Sunshine State Stats January 2020
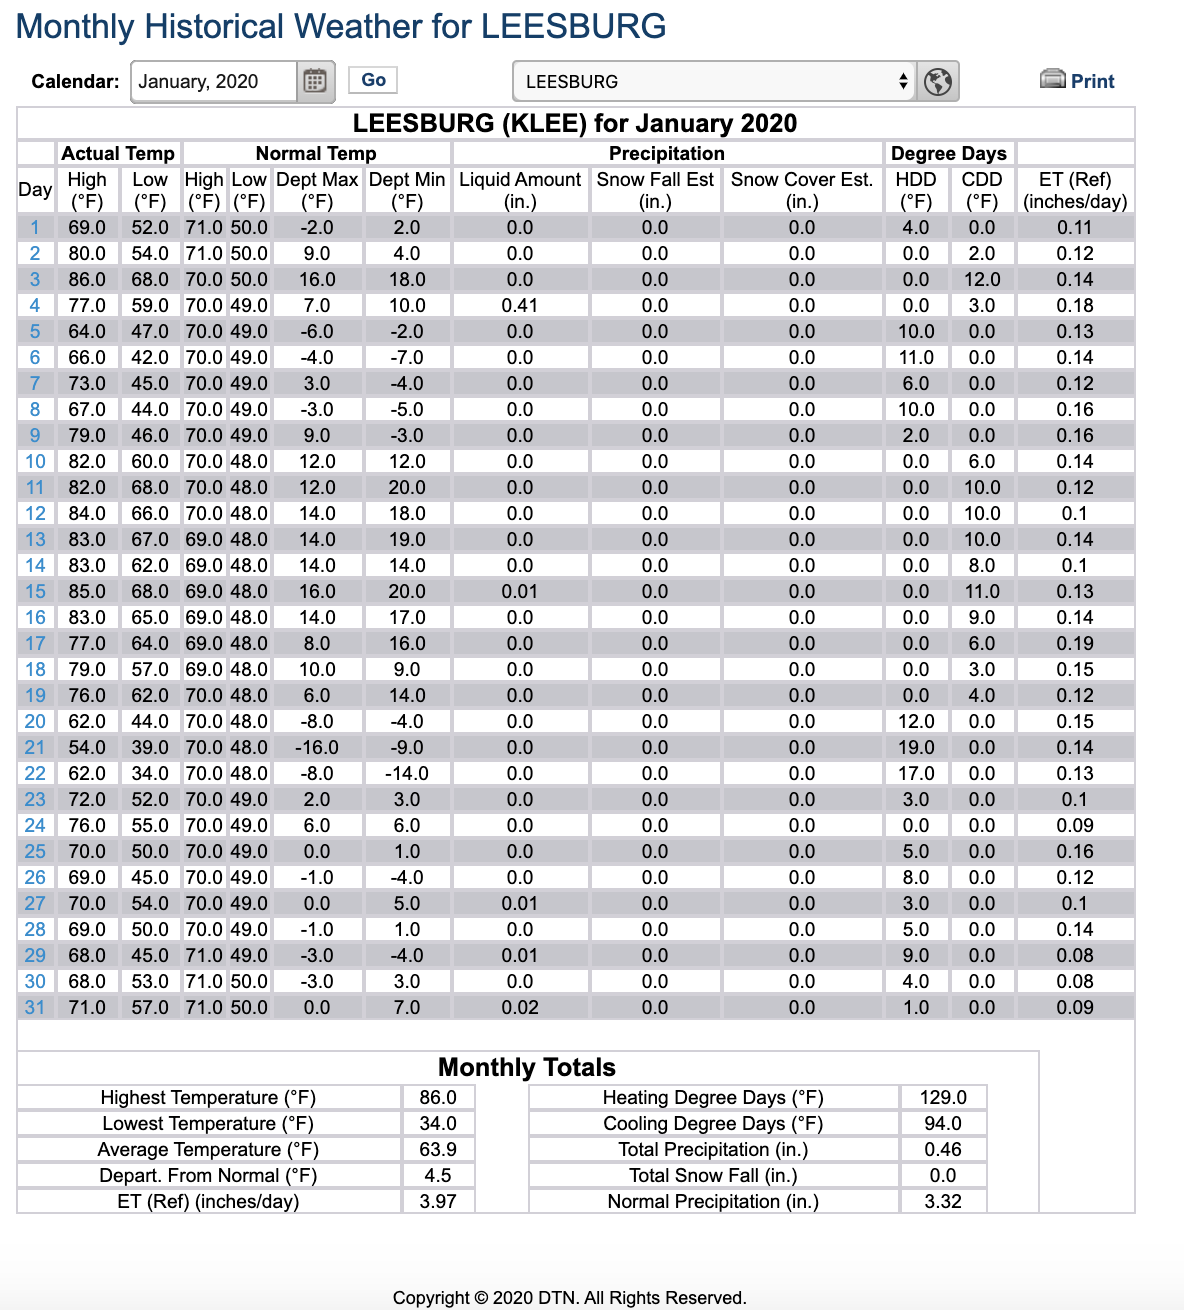
Central Floridians experienced extreme temperature variations in January 2020 with very warm daytime temperatures that reached as high as 86 degrees and overnight temperatures that dipped into the 30s and 40.
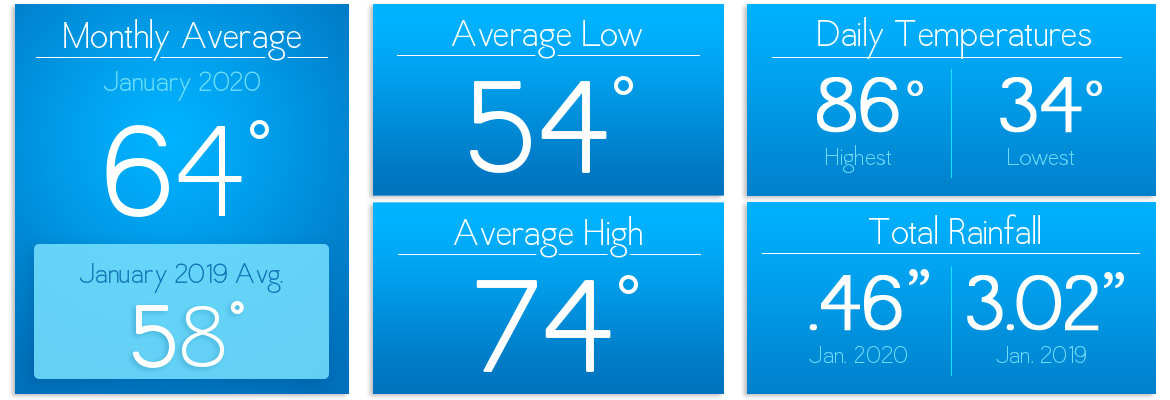
The monthly average temperature was a balmy 64 degrees – which was 6 degrees warmer than the average temperature in January 2019. The highest daily recorded temperature was 86 degrees and the lowest daily recorded temperature was 34 degrees. That’s a fluctuation of 52 degrees between hot and cold so most likely both cooling and heating units ran in January.
January 2020’s average high temperature was 74 degrees with an average low of 54. In Janaury 2019, the average high temperature was 69 degrees while the average low temperature was 47 degrees.
January 2020 low temperatures were so cold that frozen iguanas in Florida became a common sight. Locally we enjoyed 9 days of high temperatures over 80 degrees in Janaury 2020 and 11 days of low temps in the 30s and 40s. Rainfall for the month was lower than average at only .46 inches. Rainfall for January 2019 was much higher than 2020 at 3.02 inches.
Members who used heat during the colder mornings and cooling in the warmer afternoons can expect to see an increase in energy consumption on their January billing statement. ENERGY STAR recommends setting your heat to no higher than 68 degrees during the winter months.
Have you scheduled an annual HVAC service? January and February are typically the coldest months in Florida. A well-maintained unit runs more efficiently and helps lower your energy usage. Read more about HVAC service and maintenance in November SECO News.
February 2020 forecast:
February 2020 is forecast for an average high of 76 degrees most days in the month reaching temperatures in the mid-70s and 80s. The average low is forecast at 56 degrees with low temperatures dipping into the 40s and 50s. Precipitation levels are forecast to be low with the best chance for rain early in the month.
To check historical usage, log into SmartHub to view past bills and consumption charts. If your usage is high, SECO offers several energy-efficiency tools to help you identify energy wasters. Take the Home Energy Assessment to receive a detailed email tailored to your home’s features and lifestyle. The energy-saving advice will provide low-cost ways to decrease your usage – and your electric bill.
To easily calculate how much energy your appliances, lighting, electronic devices, and other energy-using items in your home consume, use the Energy Estimator.