June 2023 Sunshine State Stats
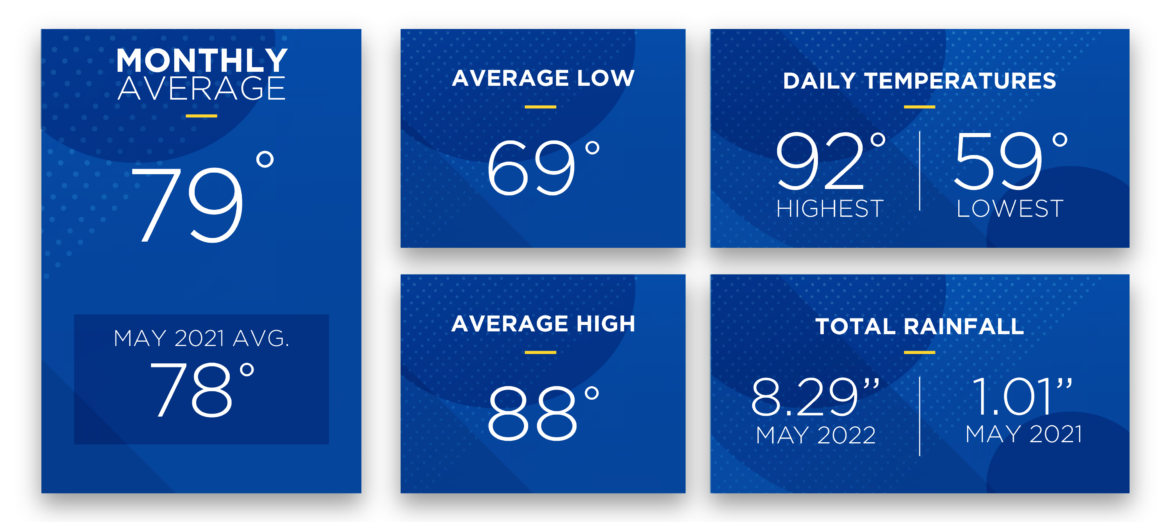
In June 2023, temperatures and rainfall moved upward from May as summer arrived with days of intense heat and heavy precipitation. The rainfall total for the month was 6.75 inches, which was an increase of 3.25 inches over May’s tally, and over twice the amount measured one year ago. June featured an increased pattern of afternoon thunderstorms, and Tropical Storms Arlene, Bret and Cindy formed but none had a significant impact on Central Florida.
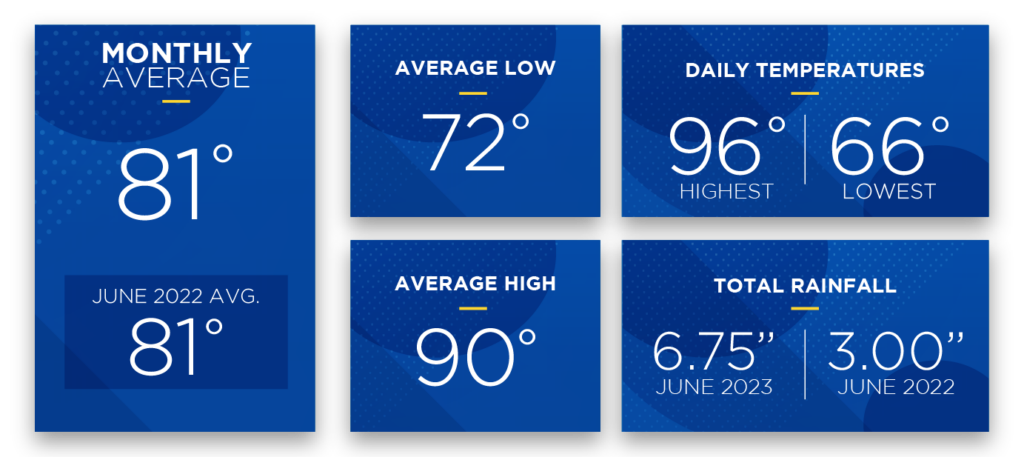
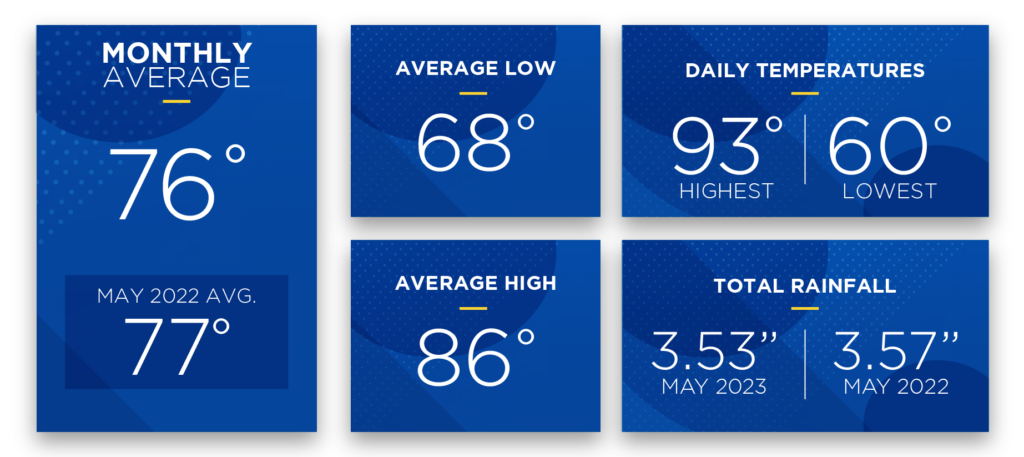
The average temperature for June 2023 was 81 degrees, which was 5 degrees higher than last month’s average. The average low was 72 degrees, a 4-degree increase over May, and the average high temperature jumped from 86 degrees in May to 90 degrees in June. With afternoon temperatures routinely settling at and above 90 degrees, members will likely experience increased kilowatt hour (kWh) usage as HVAC use becomes more frequent in combating sweltering heat. HVAC is the largest energy user in Central Florida homes – accounting for 35 to 40% of kWh usage on average.
The heat index – the apparent temperature or what the temperature feels like when combined with relative humidity – climbed in June 2023. The heat index for most of Central Florida in late June was between 100 and 110 degrees. In small pockets, the heat index rose to 110 to 120 degrees (source: National Weather Service).
The lowest recorded temperature in June was 66 degrees, while the highest daily recorded temperature was 96 (data from the Leesburg KLEE weather station). Daily high temperatures reached 90 degrees or higher nineteen times in June. The highest daily recorded temperature in May was 93 degrees and the lowest was 60.
July forecast:
The Old Farmer’s Almanac projects warm temps and scattered thunderstorms to persist throughout July in our area, with temperatures becoming milder in the third week of the month. Temperatures are forecast to average 84 degrees and precipitation is predicted to total 6 inches—one inch below average.
As usual, Atlantic hurricanes can and do appear during the June to November season. Keep your eyes on the tropics for early signs of disturbances that could strengthen and impact Florida. Take time to gather your hurricane/emergency supplies now, not later. Review our Hurricane Handbook for a list of supplies, and what actions to take before, during and after a storm. Remember, supplies sell out quickly once a storm is forecast to affect our area.
To check historical usage, log into SmartHub to view past bills and consumption charts. If your usage is high, SECO offers several energy-efficiency tools to help you identify energy wasters. Take the Home Energy Assessment to receive a detailed email tailored to your home’s features and lifestyle. The energy-saving advice will provide low-cost ways to decrease your usage – and your electric bill.
To easily calculate how much energy your appliances, lighting, electronic devices, and other energy-using items in your home consume, use the Energy Estimator.