StormCenter logo

Archive

June 2023 Sunshine State Stats

In June 2023, temperatures and rainfall moved upward from May as summer arrived with days of intense heat and heavy precipitation. The rainfall total for the month was 6.75 inches, which was an increase of 3.25 inches over May’s tally, and over twice the amount measured one year ago. June featured an increased pattern of afternoon thunderstorms, and Tropical Storms Arlene, Bret and Cindy formed but none had a significant impact on Central Florida.


June 2023 Sunshine State Stats temps


The average temperature for June 2023 was 81 degrees, which was 5 degrees higher than last month’s average. The average low was 72 degrees, a 4-degree increase over May, and the average high temperature jumped from 86 degrees in May to 90 degrees in June. With afternoon temperatures routinely settling at and above 90 degrees, members will likely experience increased kilowatt hour (kWh) usage as HVAC use becomes more frequent in combating sweltering heat. HVAC is the largest energy user in Central Florida homes – accounting for 35 to 40% of kWh usage on average.


The heat index – the apparent temperature or what the temperature feels like when combined with relative humidity – climbed in June 2023. The heat index for most of Central Florida in late June was between 100 and 110 degrees. In small pockets, the heat index rose to 110 to 120 degrees (source: National Weather Service).


The lowest recorded temperature in June was 66 degrees, while the highest daily recorded temperature was 96 (data from the Leesburg KLEE weather station). Daily high temperatures reached 90 degrees or higher nineteen times in June. The highest daily recorded temperature in May was 93 degrees and the lowest was 60.


July forecast:  


The Old Farmer’s Almanac projects warm temps and scattered thunderstorms to persist throughout July in our area, with temperatures becoming milder in the third week of the month. Temperatures are forecast to average 84 degrees and precipitation is predicted to total 6 inches—one inch below average.


As usual, Atlantic hurricanes can and do appear during the June to November season. Keep your eyes on the tropics for early signs of disturbances that could strengthen and impact Florida. Take time to gather your hurricane/emergency supplies now, not later. Review our Hurricane Handbook for a list of supplies, and what actions to take before, during and after a storm. Remember, supplies sell out quickly once a storm is forecast to affect our area.  


To check historical usage, log into SmartHub to view past bills and consumption charts. If your usage is high, SECO offers several energy-efficiency tools to help you identify energy wasters. Take the Home Energy Assessment to receive a detailed email tailored to your home’s features and lifestyle. The energy-saving advice will provide low-cost ways to decrease your usage – and your electric bill. 


To easily calculate how much energy your appliances, lighting, electronic devices, and other energy-using items in your home consume, use the Energy Estimator. 


May 2023 Sunshine State Stats

In May 2023, both the average temperature and rainfall increased slightly over Aprils total. May continued the expected trend toward typical Florida summer weather – afternoon thunderstorms increased, and we saw our first glimpses of storm activity in the tropics. No single day contributed a low temperature below the 60-degree mark, while eight days pushed the mercury higher than 90 degrees in what was a generally warm month in Central Florida. 


May 2023 Sunshine State Stats


The average temperature for May 2023 was 76 degrees, which was 1 degree higher than last month’s average. The average high was 86 degrees, while the average low was 68 degrees. With steady temperatures in the warm to hot range, members will likely notice increased kilowatt-hour (kWh) usage as they begin to increase their HVAC use to combat rising summer temperatures. HVAC is the largest energy user in Central Florida homes – accounting for 35 to 40% of kWh usage on average. 


The highest daily recorded temperature (data from the Leesburg KLEE weather station) in May was 93 degrees and the lowest was 60 – the highest daily recorded temperature in April was 92 degrees and the lowest was 54. May 2023 rainfall totaled about 3.5 inches – precipitation was more active in the second two weeks. 


June forecast:  


Look for isolated showers and a few thunderstorms as Florida’s rainy afternoons begin. Temperatures are forecast to climb into the 90s most days and drop into the low 70s in the evenings. 


Atlantic hurricane season spans June 1 to November 30. Keep your eyes on the tropics for early signs of disturbances that could strengthen and impact Florida. Now is the time to gather your hurricane/emergency supplies. Review our Hurricane Handbook for a list of supplies, and what actions to take before, during and after a storm. Remember, supplies sell out quickly once a storm is forecast to affect our area.  


To check historical usage, log into SmartHub to view past bills and consumption charts. If your usage is high, SECO offers several energy-efficiency tools to help you identify energy wasters. Take the Home Energy Assessment to receive a detailed email tailored to your home’s features and lifestyle. The energy-saving advice will provide low-cost ways to decrease your usage – and your electric bill. 


To easily calculate how much energy your appliances, lighting, electronic devices, and other energy-using items in your home consume, use the Energy Estimator. 


April 2023 Sunshine State Stats

Spring continued to blossom in April 2023. After a warmer-than-average first week, high temps took a 4-day dip into the mid-70s in the second week. The remainder of the month featured normal high and low temps ranging between the mid-80s to mid-60s, while above-average precipitation commenced mid-April.


April 2023 Sunshine State Stats SECO Energy temps


The average temperature for April 2023 was 75 degrees, which was 3 degrees higher than last month’s average. The average high was 84 degrees while the average low was 65 degrees. With the shifting temperatures from moderate to muggy during the month, members may notice increased kilowatt hour (kWh) usage as they used dehumidification and cooling in their homes. HVAC is the largest energy user in Central Florida homes – accounting for 35 to 40% of kWh usage on average.


The highest daily recorded temperature (data from the Leesburg KLEE weather station) in April was 92 degrees and the lowest was 54 – the highest daily recorded temperature in March was 92 degrees and the lowest 44. April 2023 rainfall totaled about 3 inches – falling almost entirely in the second two weeks. This is 50% more than the April average of 2 inches.


May forecast: May is set to begin with a much dryer weather pattern than during April’s exiting weeks. Temperatures continue to climb steadily through the month, with highs averaging in the mid- to upper 80s, and lows hovering near the 70 degree mark. Thunderstorm activity increases as June approaches, but overall a dip in precipitation from the month prior.


To check historical usage, log into SmartHub to view past bills and consumption charts. If your usage is high, SECO offers several energy-efficiency tools to help you identify energy wasters. Take the Home Energy Assessment to receive a detailed email tailored to your home’s features and lifestyle. The energy-saving advice will provide low-cost ways to decrease your usage – and your electric bill.


To easily calculate how much energy your appliances, lighting, electronic devices, and other energy-using items in your home consume, use the Energy Estimator.


March 2023 Sunshine State Stats

Spring arrived in March 2023. While daily high temperatures increased during the month, cold temperatures continued as well. High daily temperatures ranged between the mid 60s and low 90s. Low daily temperatures dipped into the 40s.


March 2023 Sunshine State Stats temps


The average temperature for March 2023 was 72 degrees, which was 2 degrees higher than last month’s average. The average high was 84 degrees while the average low was 60 degrees. With the shifting temperatures from cool to hot during the month, members may notice increased kilowatt hour (kWh) usage as they used both heating and cooling in their homes. HVAC is the largest energy-user in Central Florida homes – accounting for 35 to 40% of kWh usage on average.


The highest daily recorded temperature (data from the Leesburg KLEE weather station) in March was 92 degrees and the lowest 44 – the highest daily recorded temperature in February was 88 degrees and the lowest 46. March 2023 lacked rainfall – only .16 inches – which is drastically lower than the March average of 4.03 inches.


April forecast:


Daily highs in the 90s will continue through April with lows in the mid to high 60s. The best chance of rain comes early in the month, but dry conditions are predicted to continue.


To check historical usage, log into SmartHub to view past bills and consumption charts. If your usage is high, SECO offers several energy-efficiency tools to help you identify energy wasters. Take the Home Energy Assessment to receive a detailed email tailored to your home’s features and lifestyle. The energy-saving advice will provide low-cost ways to decrease your usage – and your electric bill.


To easily calculate how much energy your appliances, lighting, electronic devices, and other energy-using items in your home consume, use the Energy Estimator.


January 2023 Sunshine State Stats

January 2023 temperatures ranged between the 20s and 80s in the same month. Temperatures dropped to as low as 26 degrees on January 15 (data from the Ocala KOCF weather station) in SECO Energy’s service area and highs climbed to 85.


January 2023 Sunshine State Stats temps


The average temperature for January 2023 was 63 degrees, which was 1 degree lower than last month’s average. The average high was 74 degrees while the average low was 52 degrees. With the shifting temperatures from very cold to hot during the month, members may notice increased kilowatt hour (kWh) usage as they used both heating and cooling in their homes. The HVAC is the largest energy-user in Central Florida homes – accounting for 35 to 40% of kWh usage on average.


The highest daily recorded temperature (data from the Leesburg KLEE weather station) in January was 85 degrees and the lowest 35 – the highest daily recorded temperature in December was 83 degrees and the lowest 29. Rainfall in January 2023 was well below the average of 3.32 inches to measure only 1.22 inches.


February forecast:


Expect daily highs to reach the low 80s with lows in the mid-50s in February 2023. The Old Farmer’s Almanac predicts winter temperatures will be between 1 to 4 degrees below average, which has held true for the Winter 2023 season.


To check historical usage, log into SmartHub to view past bills and consumption charts. If your usage is high, SECO offers several energy-efficiency tools to help you identify energy wasters. Take the Home Energy Assessment to receive a detailed email tailored to your home’s features and lifestyle. The energy-saving advice will provide low-cost ways to decrease your usage – and your electric bill.


To easily calculate how much energy your appliances, lighting, electronic devices, and other energy-using items in your home consume, use the Energy Estimator.


September 2022 Sunshine State Stats

Hurricane Ian blazed through Central Florida between Wednesday, September 28, and Thursday, September 29, bringing large amounts of rainfall, high winds and fall temperatures. The average temperature for the month was 81 degrees, which was 3 degrees lower than last month’s average. The average high was 88 degrees while the average low was 73 degrees.


September 2022 Sunshine State Stats temps


The highest daily recorded temperature (data from the Leesburg KLEE weather station) in September was 95 degrees and the lowest 63 – the highest daily recorded temperature in August 2022 was 96 degrees and the lowest was 72. Rainfall was above average in September. The total precipitation for the month was 7.25 inches, well above the September average rainfall of 5.76 inches.


Daily high temperatures soared over 90 degrees 16 days in September. Hurricane Ian brought a slight cooldown to daily temperatures toward the end of the month. Expect daily highs to reach near 90 degrees into October.


Before September, the 2022 Atlantic hurricane season was mostly inactive. Hurricane Ian made landfall as a strong Category 4 hurricane on Florida’s west coast. It traveled slowly through southwest and central Florida before exiting into the Atlantic and making another landfall in South Carolina. Hurricane Ian was deadly and caused power outages for millions in the southeast United States. At its peak, SECO Energy had just over 11,000 accounts without electric service overnight on the 28th and 29th. All accounts were restored by late on Friday, September 30. It only takes one powerful storm to damage electric transmission and distribution infrastructure causing widespread power outages.


Have a plan in place for hurricane season. Don’t wait until a storm is approaching to prepare. Essential supplies such as water, gasoline, bread and other non-perishable food sell out quickly. Read our Hurricane Handbook to learn more about what to do before, during and after a tropical storm or hurricane.


October forecast:


Expect daily high temperatures to reach into the high to mid 80s during October 2022. Be alert for late-season tropical storm and hurricane activity heading toward Central Florida. Central Florida’s rainy season is winding down, expect less rain and thunderstorms during the month.


HVAC use may be starting to decrease with cooler daily and evening temperatures. For Floridians, HVAC use is a longer span (typically early spring to late fall) than in other parts of the country and runs more frequently. It is likely the highest energy user in your home. Before winter temperatures set in, schedule an HVAC tune up with a qualified technician.


To check historical usage, log into SmartHub to view past bills and consumption charts. If your usage is high, SECO offers several energy-efficiency tools to help you identify energy wasters. Take the Home Energy Assessment to receive a detailed email tailored to your home’s features and lifestyle. The energy-saving advice will provide low-cost ways to decrease your usage – and your electric bill.


To easily calculate how much energy your appliances, lighting, electronic devices, and other energy-using items in your home consume, use the Energy Estimator.


July 2022 Sunshine State Stats

July 2022 in Central Florida was extremely hot and especially soggy. The average temperature for the month was 84 degrees, which was 1 degree warmer than last month’s average. The average high was 93 degrees while the average low was 76 degrees.


July 20222 SECO Energy Sunshine State Stats temps


The highest daily recorded temperature (data from the Leesburg KLEE weather station) in July was 96 degrees and the lowest 71 – the highest daily recorded temperature in June 2022 was 98 degrees and the lowest was 69. Rainfall was above average in July. The total precipitation for the month was 12.31 inches, well above the July average rainfall of 5.67 inches.


Daily high temperatures soared over 90 degrees most days in July – 29 days of the month the daily high temp reached 90 or higher. Expect daily highs to reach into the 90s for the rest of the summer and usually into October.


Atlantic hurricane season lasts through November 30. While the Colorado State University (CSU) Tropical Meteorology Project team updated its 2022 Atlantic hurricane season forecast predicting well-above-average tropical storm and hurricane activity, the tropics have remained mostly clear early in the season. September is generally the most active month for hurricane and tropical storm activity. Have a plan in place for hurricane season. Don’t wait until a storm is approaching to prepare. Read our Hurricane Handbook to learn more about what to do before, during and after a tropical storm or hurricane.


August forecast:


Daily high temperatures will reach into the 90s for most if not all of August 2022. Daily thunderstorms are forecast throughout the month.


With increased daily temperatures, HVAC use increases as well as energy consumption. The EIA calculates the highest amount of electricity consumed in the U.S. is attributed to HVAC use. For Floridians, HVAC use is a longer span (typically early spring to late fall) than in other parts of the country and runs more frequently. It is likely the highest energy user in your home. Set your thermostat at 78 degrees or higher in the summer – every degree lower than 78 will increase your monthly bill by 6 to 8%.


To check historical usage, log into SmartHub to view past bills and consumption charts. If your usage is high, SECO offers several energy-efficiency tools to help you identify energy wasters. Take the Home Energy Assessment to receive a detailed email tailored to your home’s features and lifestyle. The energy-saving advice will provide low-cost ways to decrease your usage – and your electric bill.


To easily calculate how much energy your appliances, lighting, electronic devices, and other energy-using items in your home consume, use the Energy Estimator.


June 2022 Sunshine State Stats

June 2022 was hot, hot, HOT! The average temperature for the month was 83 degrees, which was 4 degrees warmer than last month’s average. The average high was 92 degrees while the average low was 73 degrees.


June 2022 Sunshine State Stats temps


The highest daily recorded temperature (data from the Leesburg KLEE weather station) in June was 98 degrees and the lowest was 69 – the highest recorded daily temperature in May 2022 was 92 degrees and the lowest recorded daily temperature was 59. Parts of SECO Energy’s service area experienced heavy rain and winds in June while others stayed relatively dry. Rainfall measured 3.2 inches in June 2022, which is almost 3 inches below average.


Daily temperatures over 90 degrees were the norm for June – 26 days of the month the daily high temp reached 90 or higher. Summer temperatures are here to stay in Central Florida. Through September and into October, expect daily highs to reach into the 90s with lows in the 60s and 70s.


Atlantic hurricane season lasts through November 30. The Colorado State University (CSU) Tropical Meteorology Project team updated its 2022 Atlantic hurricane season forecast. According to these experts, expect well-above-average tropical storm and hurricane activity this season. For 2022, 20 named storms are predicted compared to the average of 14.4 named storms between 1991 and 2020. Now is the time to have a plan in place for hurricane season. Don’t wait until a storm is approaching to prepare. Read our Hurricane Handbook to learn more about what to do before, during and after a tropical storm or hurricane.


July forecast:


Daily high temperatures will reach into the 90s for July 2022. Expect almost daily thunderstorms during the first half of the month. Energy consumption increases in the summer months.


The EIA calculates the highest amount of electricity consumed in the U.S. is attributed to HVAC use. For Floridians, HVAC use is a longer span (typically early spring to late fall) than in other parts of the country and runs more frequently. It is likely the highest energy user in your home. Set your thermostat at 78 degrees or higher in the summer – every degree lower than 78 will increase your monthly bill by 6 to 8%.


To check historical usage, log into SmartHub to view past bills and consumption charts. If your usage is high, SECO offers several energy-efficiency tools to help you identify energy wasters. Take the Home Energy Assessment to receive a detailed email tailored to your home’s features and lifestyle. The energy-saving advice will provide low-cost ways to decrease your usage – and your electric bill.


To easily calculate how much energy your appliances, lighting, electronic devices, and other energy-using items in your home consume, use the Energy Estimator.


SECO News July 2022

Dear Members,

SECO Energy continues to deal with supply chain constraints due to the pandemic aftermath. Utilities across the state and the nation are experiencing shortages of raw materials, labor shortages, shipping delays and increased demand for utility products. We are challenged to procure transformers, PVC pipe, meter boxes and any equipment that relies on a microchip. This shift changes our business model to operating around the available materials. In fact, utilities across the state and the nation are feeling the strain of the supply chain issue.  Learn more from the Florida Electric Cooperatives Association in its recent statement.  


These constraints also result in increased cost of inventory and price escalation due to runaway inflation – which is at a 40-year high. In May, the price of natural gas hit a decade high $9 per million BTUs (British thermal units) and this significantly affects the cost of power SECO delivers to you from our wholesale provider, Seminole Electric Cooperative. Given the domestic and global events causing these market trends to continue, SECO must prepare to meet our business targets and member requests in an environment today that is extremely challenging. 


We anticipate the continuation of cost increases and supply chain interruptions. Ultimately, these factors will result in our members paying more for their energy needs – just as we at SECO find ourselves paying more for the materials we buy to construct new services and maintain existing infrastructure.  


Roughly 70 cents of every dollar SECO spends is to purchase power from Seminole. Members who read SECO News regularly and review their electric bill each month have seen a line item referred to as the PCA – or Power Cost Adjustment. This calculation allows SECO to adjust for the rise or fall of fuel costs in real time without formally adjusting the actual rate.  


This is a common utility practice that prevents the over or under collection of funds from our members. The PCA factor was changed in April bringing our cost per thousand kilowatt hours from $121.00 to $128.05. Unfortunately, projections from Seminole require us to make yet another adjustment to the PCA – sooner rather than later. 


The fuel cost adjustment was approved by the Board and takes effect on July 1 with an increase to $137.60 per thousand kilowatt hours consumed at the residential level. Know that utilities across the state and the nation for that matter are all in the same boat and are making fuel cost adjustments and raising rates. 


Notwithstanding all of this, SECO will strive, as we always do, to minimize such impact on our members by keeping our rates as affordable as possible and making sure our rates remain competitive locally, regionally and nationally. 


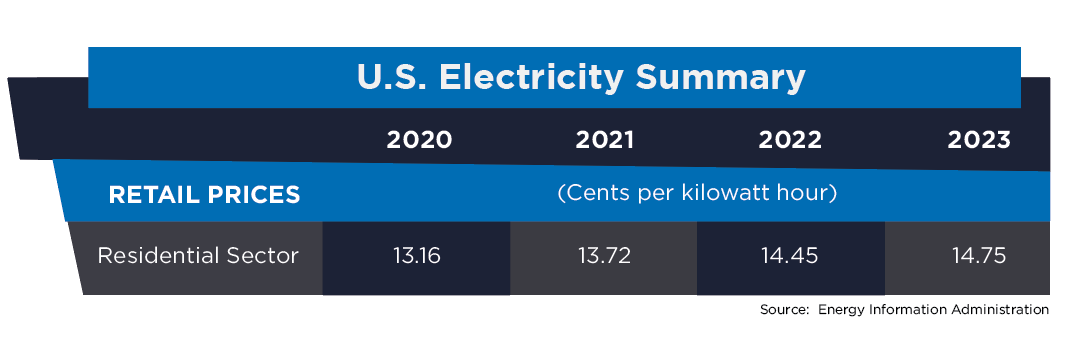
In a June report from the Energy Information Administration (EIA), it forecasts the U.S. residential electricity price will average 14.6 cents/kWh between June and August 2022. SECO’s residential cost per kWh remains well below that and we’re hopeful we can hold that line through the remainder of the summer when members consume the most energy. 


I realize that I’ve written to you largely about costs this month, but I want to close with the topic of reliability. Surveys show that the reliability of electric service is the most important driver of member satisfaction. Despite our collective current cost crunch, we continue to invest in expanding and maintaining our electric facilities throughout the entire service territory. With hurricane season upon us, I encourage you to view our System Improvement Map at SECOEnergy.com for Expansion and Reliability Projects to see where contractors and SECO Energy crews are working to enhance your experience as a SECO Energy member. 


Sincerely,


Curtis Wynn

Chief Executive Officer


Advice From The Old Farmer's Almanac

Advice From The Old Farmer’s Almanac: Summer Fishing Days


Cast a line, the fishing’s fine! The best fishing time is when fish are most active just after sunup and as the sun is going down and for an hour after. According to The Old Farmer’s Almanac, anglers should fish during the full moon period when tides are higher than average. Also, one hour before and one hour after the high tides in your favorite fishing spot is an ideal time. Another indication of a good fishing day is when the breeze comes from the west, and the water is still or only slightly rippled. Fishing with family or friends, or enjoying quiet time alone makes for a great day!


The best fishing days are between the new and full moon according to The Old Farmer’s Almanac. This summer, drop your line between July 1 – 13, July 28 – August 11 and August 27 – September 10. Read Florida Fauna & Flora this month to learn about red snapper.


SECO News July 2022 Summer Energy Efficiency Savings

Summer Energy Efficiency Savings

The long, hot days of summer are here. The EIA calculates the highest amount of electricity consumed in the U.S. is attributed to HVAC use. For Floridians, HVAC use is a longer span (typically early spring to late fall) than in other parts of the country and runs more frequently. It is likely the highest energy user in your home.


Energy efficiency and reducing energy costs are hot topics, especially in the summer months. SECO Energy offers several online tools to help members understand their home usage and identify energy wasters. 


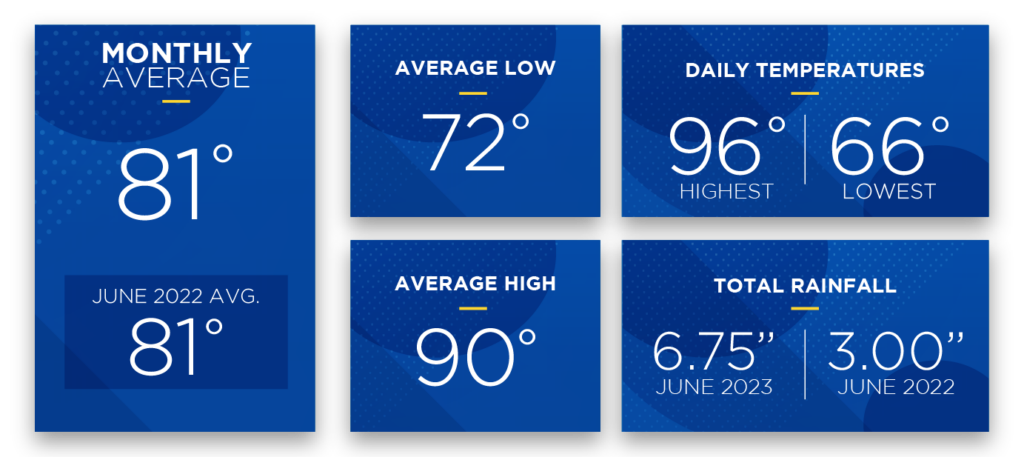
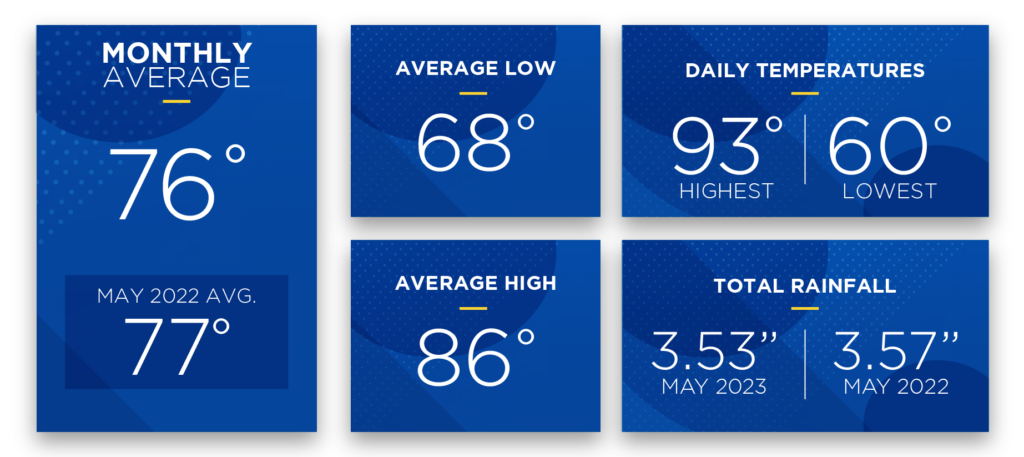
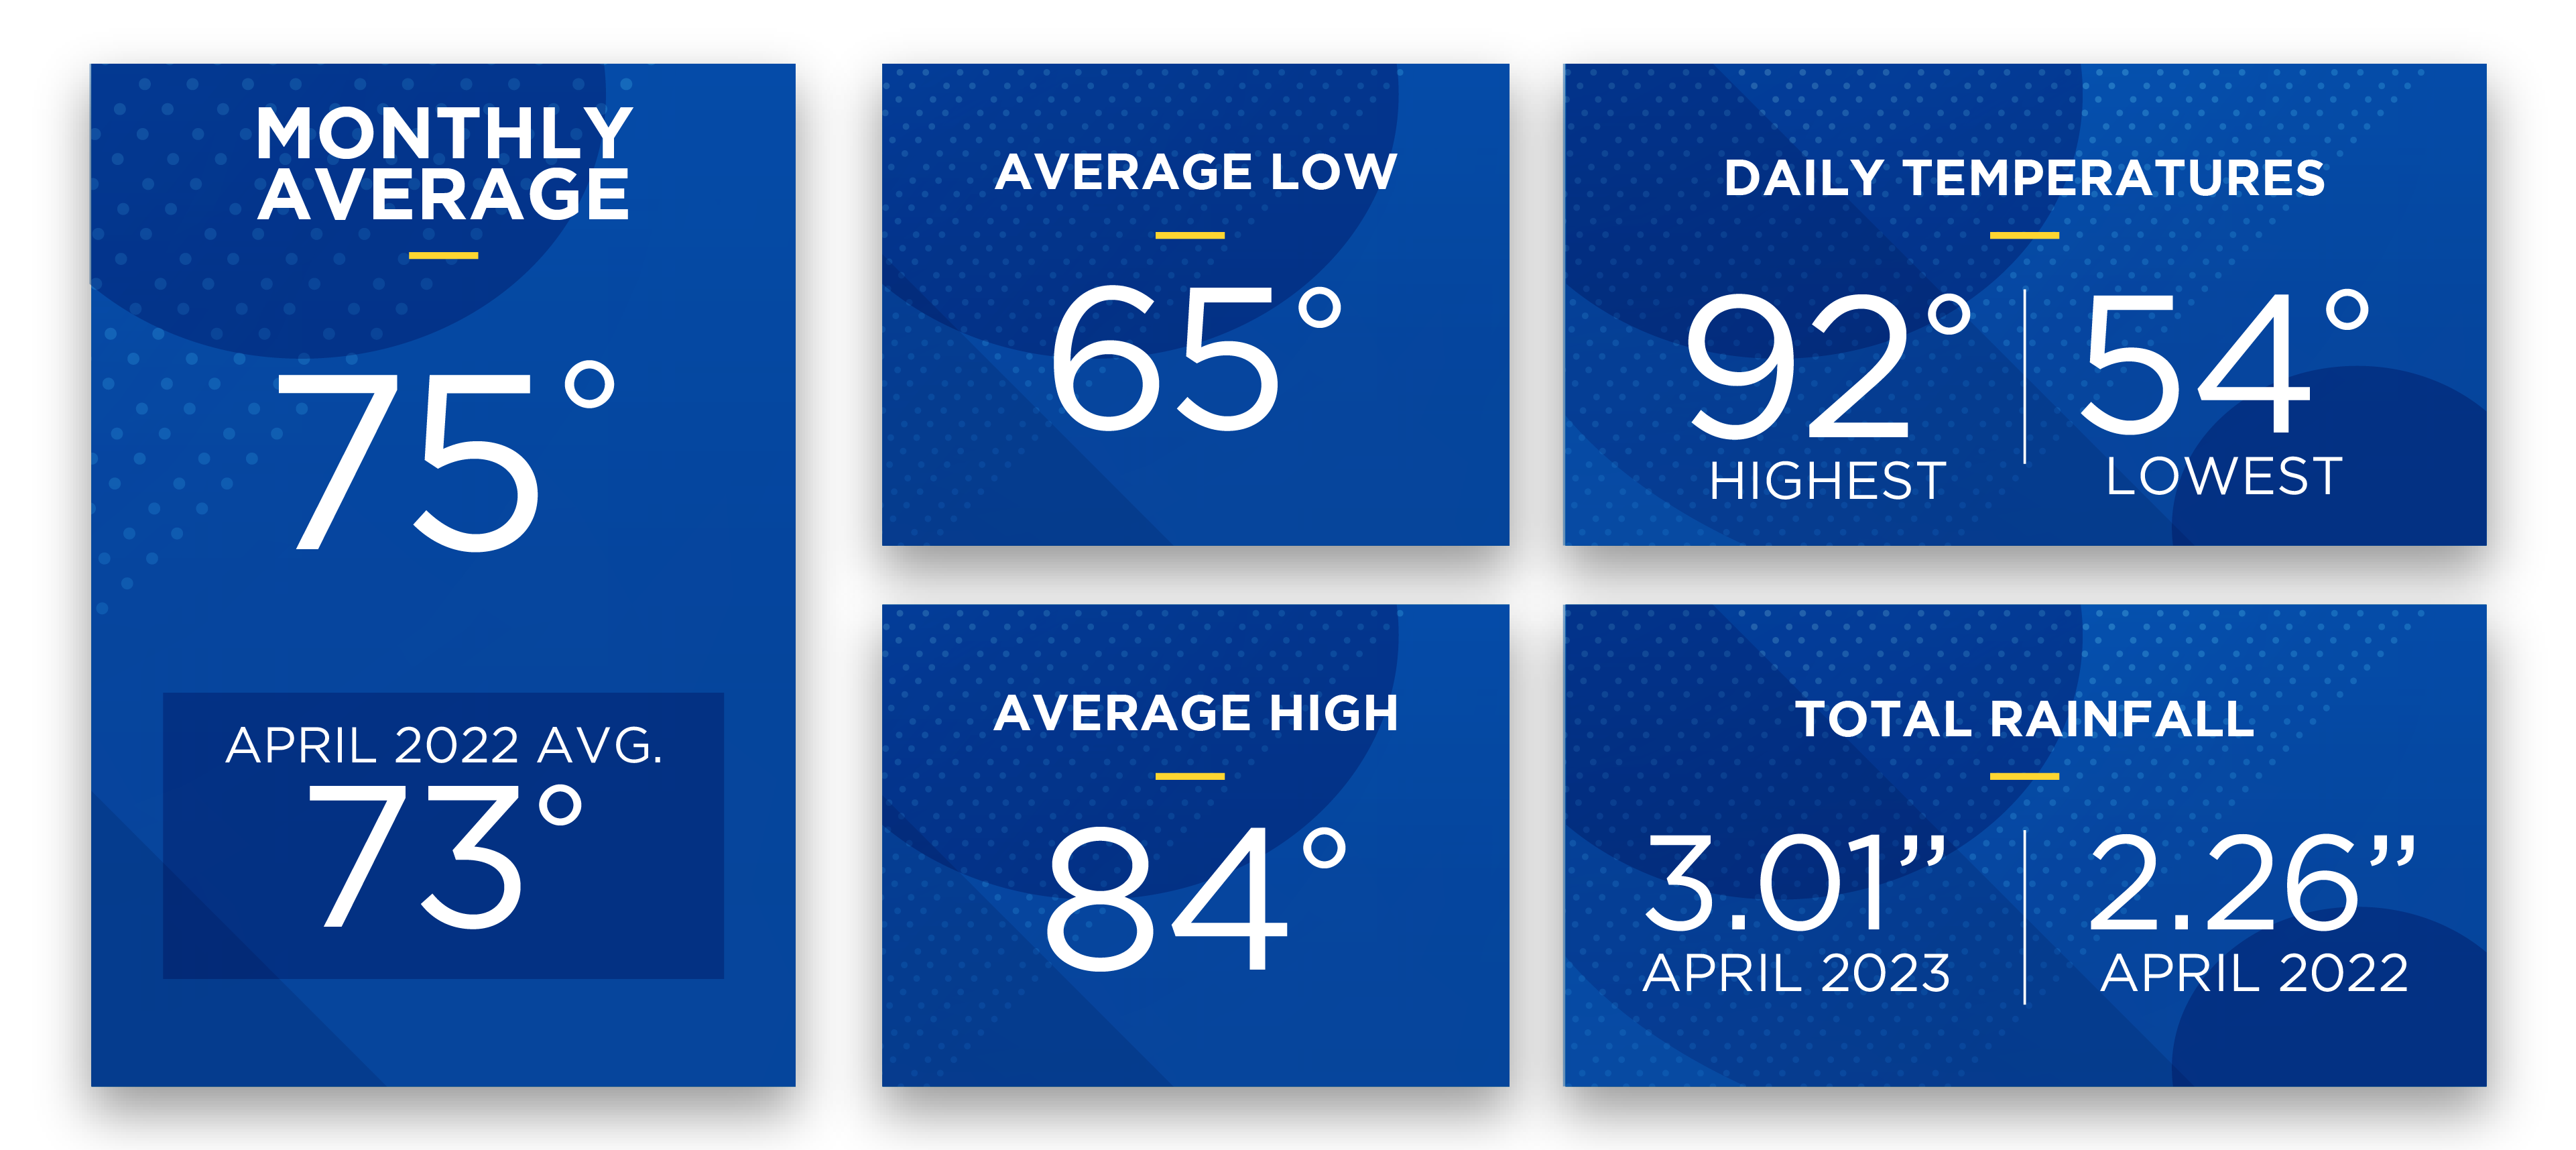
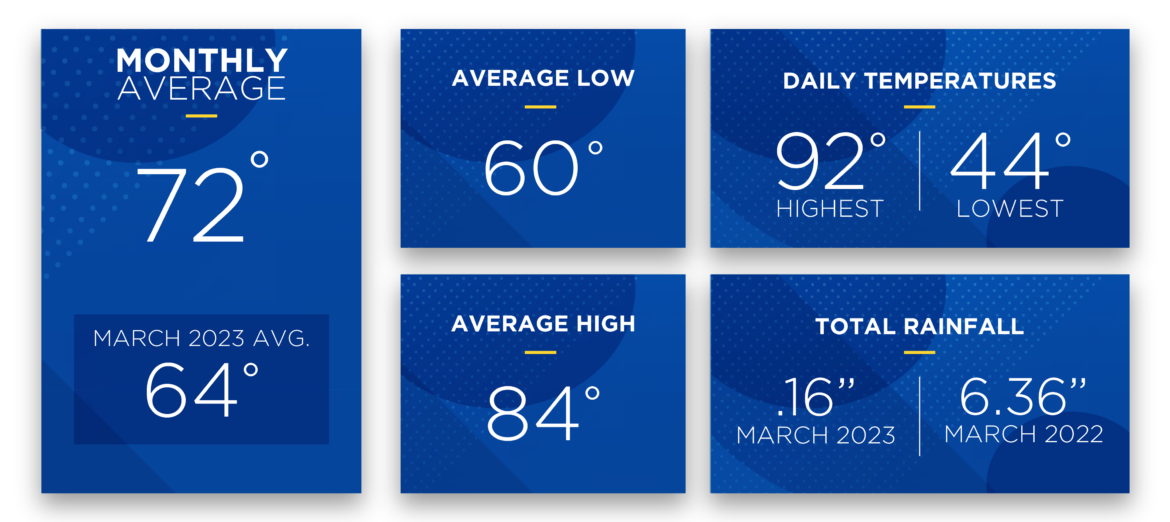
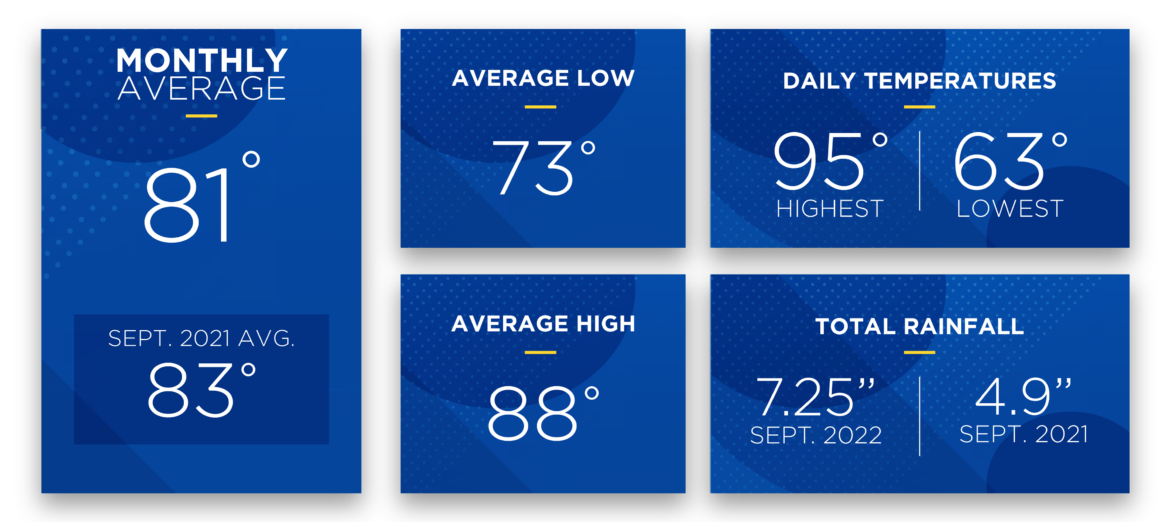
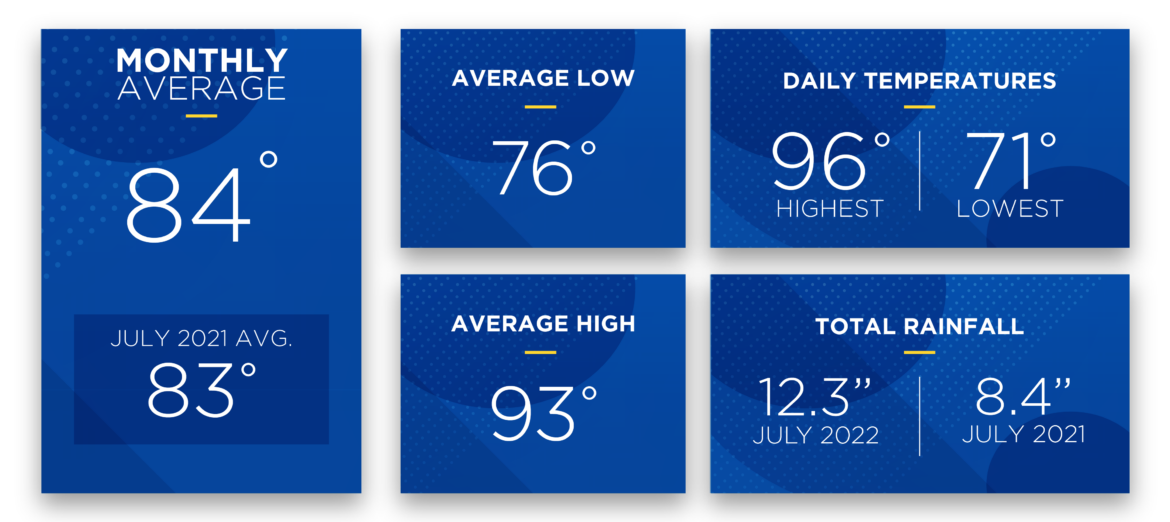
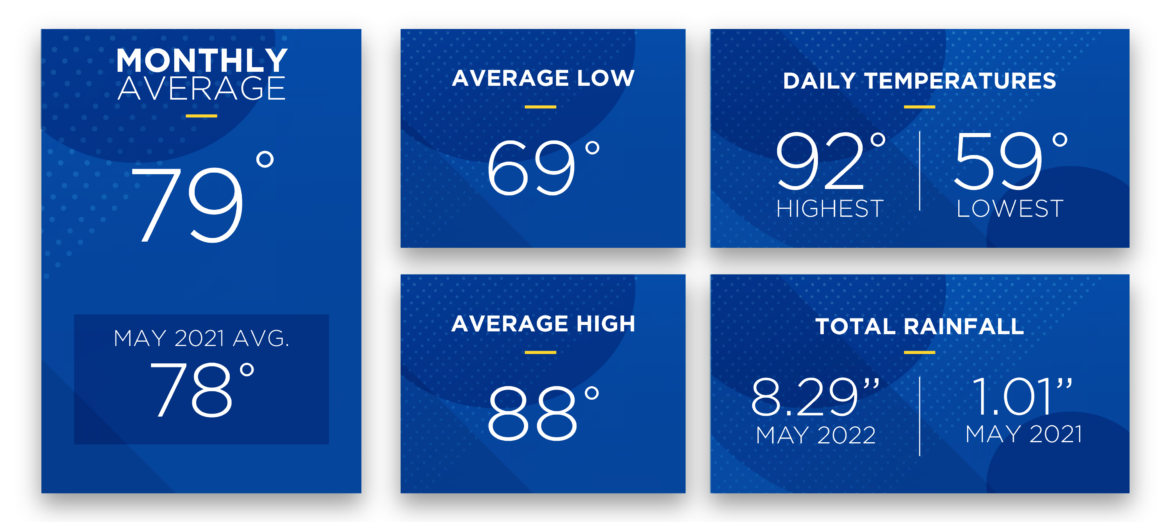
The first stop is SmartHub, SECO’s online account platform. See past bills to compare last year’s usage with 2022’s usage – is it higher? Is it related to the weather? Visit our Sunshine State Stats in the Newsroom Blog to see how temperatures fluctuate and affect your bill. 


Your next stop is our online Home Energy Assessment – a home energy audit you conduct from the comfort of home. Fill out the assessment based on your home’s specifics (construction type, roof age, amount of insulation, etc.) and lifestyle. Submit your answers to receive personal energy-savings advice tailored to the data you input in the Assessment. Implement our suggestions, and you’ll be on your way to consuming less energy – and saving money.

Energy Usage Chart


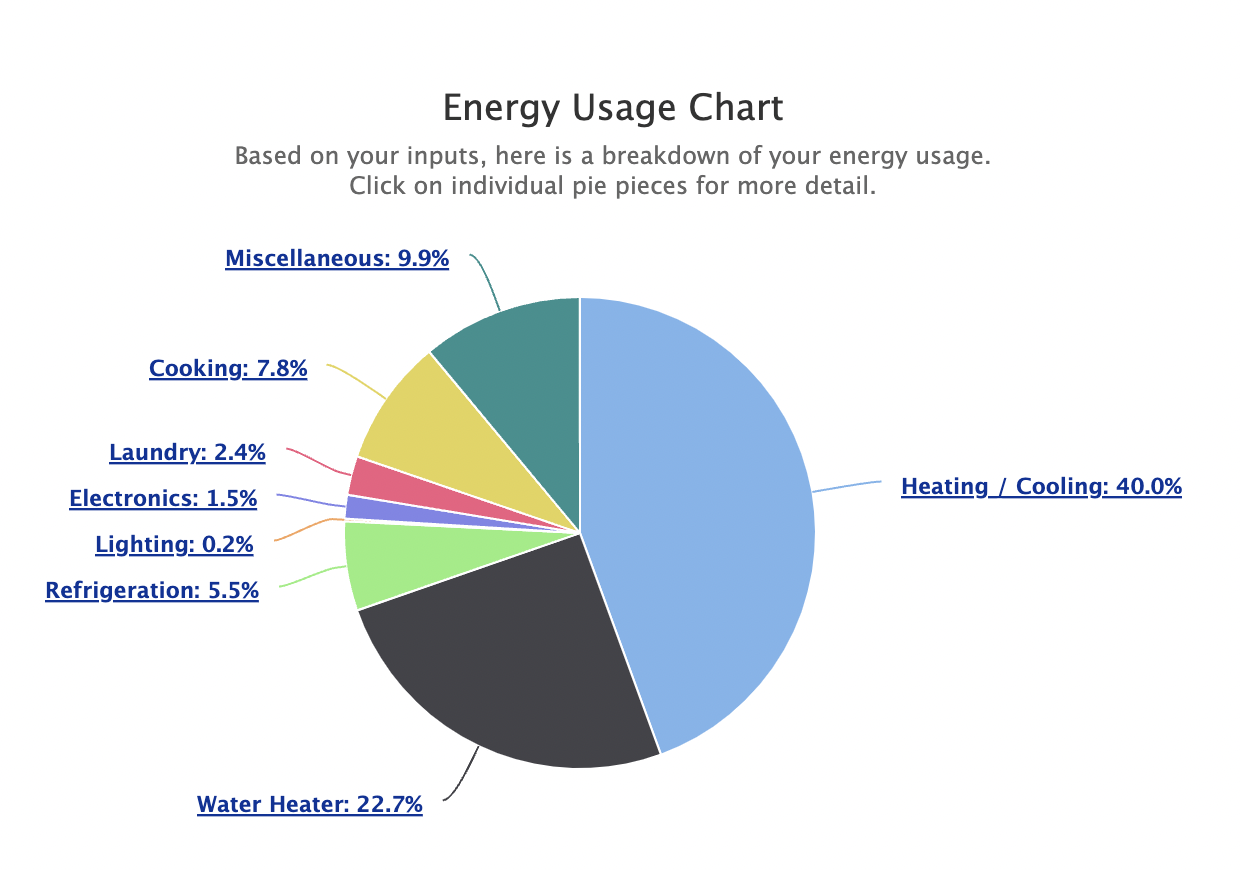
The Energy Estimator is an online tool that explores the math associated with your energy usage. The Estimator will calculate the estimated cost for each of your home’s appliances and electronics. Submit your email address to receive no-cost and low-cost energy-savings suggestions via email.


You’ll find these energy-efficiency tools and more energy-saving tips at SECOEnergy.com > Energy Solutions. Use our online tools today to save energy and money tomorrow.


SECO News July 2022 Florida Fauna & Flora: Red Snapper

Florida Fauna & Flora: Red Snapper


Florida’s Fish and Wildlife Conservation Commission announced that Florida’s 2022 recreational red snapper season opened June 17 and runs consecutively through July 31. Visit myfwc.com for upcoming fall dates.


Red snapper in deeper waters tend to be redder than those caught in shallower waters. They have a long triangular face with the upper part sloping more strongly than the lower and earned the name snapper from their enlarged canine teeth. 


Age wise, red snapper can live a long time—red snapper as old as 57 years have been reported in the Gulf of Mexico and can grow to 40 inches long and 50 pounds. Females are able to reproduce as early as age 2. Males and females spawn from May to October, depending on their location.


Red snapper feed on fish, shrimp, crab, worms, cephalopods (octopus or squid) and some plankton. Young red snapper are food for the large carnivorous fish that share their habitat, such as jacks, groupers, sharks, barracudas, and morays.


These fish are generally found at 30 to 620 feet deep in the Gulf of Mexico and along the eastern coasts of North America, Central America, and northern South America. They are rare north of the Carolinas.


Read the full July 2022 SECO News online.


May 2022 Sunshine State Stats

Summer-like heat and heavy rainfall arrived in Central Florida in May 2022. The average temperature for the month was 79 degrees, which was 6 degrees warmer than last month’s average. The average high was 88 degrees while the average low was 69 degrees.


May 2022 Sunshine State Stats temperatures


The highest daily recorded temperature in May was 92 degrees and the lowest was 59 – the highest recorded daily temperature in April 2022 was 90 degrees and the lowest recorded daily temperature was 45. May was soggy with higher-than-average rainfall that totaled 8.29 inches, which was over 4 inches above average.


High daily temperatures remained near 90 degrees for most of the month. Every day this month reached over 80 degrees – with 11 days over 90 degrees. Summer temperatures are starting to be in full swing, expect daily highs in the 80s, 90s and above. Temperatures at night and early morning are warming up, too. Thirty days in the month the low temperature reached into the 60s and 70s.


Atlantic hurricane season began June 1 with potential tropical storm activity In the Gulf of Mexico. Now is the time to have a plan in place for hurricane season. Don’t wait until a storm is approaching our shores to prepare. Read our Hurricane Handbook to learn more about what to do before, during and after a tropical storm or hurricane.


June forecast:


Daily high temperatures will soar over 80 degrees and into the 90s for June 2022. The best chance for rain is early to mid-month. Members may notice an increase in their monthly energy usage during the summer months. HVAC use is the highest percentage of energy use in Central Florida homes. Set your thermostat at 78 degrees or higher in the summer – every degree lower than 78 will increase your monthly bill by 6 to 8%.


The Old Farmer’s Almanac predicts a hot and dry June with an average temperature of 82 degrees, which is above average. Rainfall is predicted to be below average.


To check historical usage, log into SmartHub to view past bills and consumption charts. If your usage is high, SECO offers several energy-efficiency tools to help you identify energy wasters. Take the Home Energy Assessment to receive a detailed email tailored to your home’s features and lifestyle. The energy-saving advice will provide low-cost ways to decrease your usage – and your electric bill.


To easily calculate how much energy your appliances, lighting, electronic devices, and other energy-using items in your home consume, use the Energy Estimator.