StormCenter logo

Archive

November 2021 Sunshine State Stats

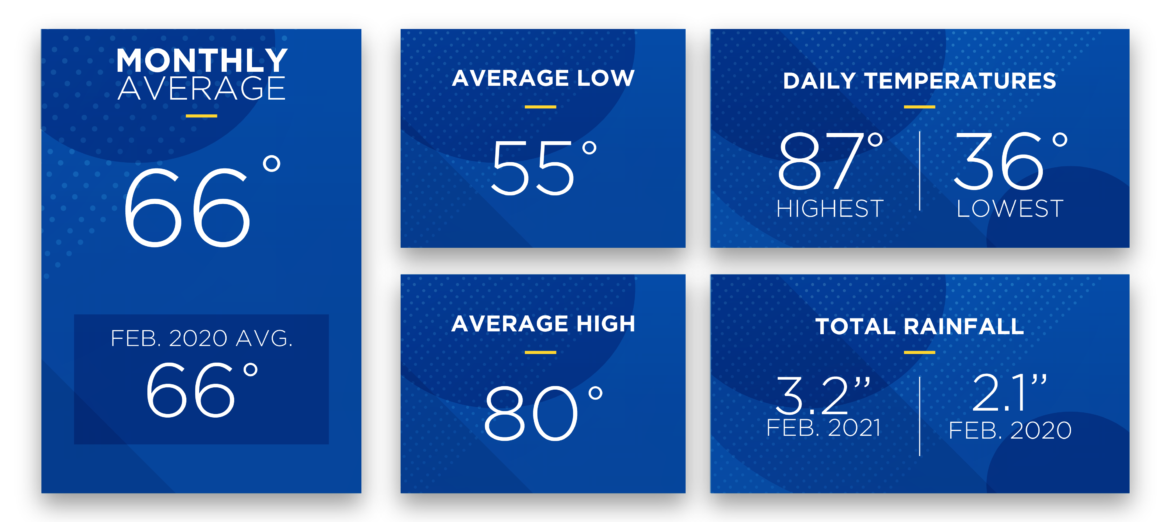
Central Florida felt its first winter-like temperatures in November 2021. The average high temperature reached 76 degrees, while the average low reached only 56 degrees. The average temperature for the month was a cool 66 degrees which is 12 degrees lower than the previous month.


November 2021 Sunshine State Stats temps


In November 2021, the highest daily temperature recorded was 85 degrees, which is 10 degrees lower than the highest recorded temp in October 2021. The lowest recorded temperature this month was 45 degrees, which is 12 degrees lower than the lowest temp recorded in October 2021. Rainfall increased this month to measure 3.61 inches and is above November’s average of 2.53 inches.


The Atlantic hurricane season officially ended on November 30, with Central Florida remaining unscathed for the season.


Members may notice their energy usage for November 2021 increase slightly from October 2021 if you’re running the heat on chilly mornings/evenings. Daily temperatures that reach into the 80s and chilly mornings in the 40s, along with Florida’s humidity mean HVACs will run for longer periods of time and more frequently to keep temperatures stable inside the home. Wide daily temperature fluctuations also increase HVAC usage. In November 2021, the largest daily temperature fluctuation was 30 degrees.


December forecast:


The Old Farmer’s Almanac predicts winter in Florida will be colder than usual. Prepare for the most frigid temperatures to begin in mid-December and continue into early February. Precipitation will also be above average.


With temperatures running colder than average, your HVAC (heating, ventilation and air conditioning) unit may run longer and more frequently this year than in previous years. Now is the time to schedule an HVAC service call with a licensed technician. Read December 2021 SECO News to learn more about scheduling a winter HVAC service.


For December 2021, The Old Farmer’s Almanac predicts the temperature will average 62 degrees for the month, which is 1 degree below average. Precipitation is forecast to be 3 inches above average. Look for daily highs in the low 80s to low 70s with lows dipping into the low 50s.


Take the bite out of damaging surges and spikes with SECO Energy’s Surge MitiGator surge protection. Our meter-based surge arrester protects large appliances by reducing surges BEFORE they enter the meter. Learn more about the Surge MitiGator.


To check historical usage, log into SmartHub to view past bills and consumption charts. If your usage is high, SECO offers several energy-efficiency tools to help you identify energy wasters. Take the Home Energy Assessment to receive a detailed email tailored to your home’s features and lifestyle. The energy-saving advice will provide low-cost ways to decrease your usage – and your electric bill.


To easily calculate how much energy your appliances, lighting, electronic devices, and other energy-using items in your home consume, use the Energy Estimator.


October 2021 Sunshine State Stats

Fall-like temperatures arrived in Central Florida in October 2021. Cooler morning and nighttime temperatures dipped into the 60s and 70s, while daily highs continued to peak at over 90 degrees. The average temperature for the month was a balmy 78 degrees which is 5 degrees lower than the previous month.


October 2021 Sunshine State Stats temps


In October 2021, the highest daily temperature recorded was 95 degrees, which is the same as the highest recorded temp in September 2021. The lowest recorded temperature this month was 57 degrees, which 10 degrees lower than the lowest temp recorded in September 2021. Rainfall decreased this month to measure 2.74 inches and is only slightly above October’s average of 2.54 inches.


The average high temperature in October 2021 was 88 degrees, and the average low temperature was 69.


As a reminder, the Atlantic hurricane season runs through November 30. It is best to remain vigilant and prepared in the event a late-season tropical storm or hurricane turns our way before the end of the season.


Although the average monthly temperature and average low and high temperatures have decreased from September 2021, daily temperatures are still warm. Members may notice their energy usage for October 2021 will be slightly less than their usage from September 2021 – unless you’re already running the heat on chilly mornings/evenings. Warm daily temperatures and Florida’s humidity mean HVACs will run for longer periods of time and more frequently to keep the temperatures cool inside. Daily temperature fluctuations also increase HVAC usage.


November forecast:


The Old Farmer’s Almanac predicts November temperatures will average 66 degrees for the month, which is 5 degrees below average. This means your heating may be operating more frequently than it did last year at this time. Precipitation is forecast to be 1 inch above average. Look for daily highs in the low 80s to high 70s with lows in the low 60s and high 50s.


Before winter temperatures arrive, consider scheduling an HVAC tune-up. Regular maintenance helps your unit run more efficiently and can diagnose small issues before they become bigger problems.


Take the bite out of damaging surges and spikes with SECO Energy’s Surge MitiGator surge protection. Our meter-based surge arrester protects large appliances by reducing surges BEFORE they enter the meter. Learn more about the Surge MitiGator.


To check historical usage, log into SmartHub to view past bills and consumption charts. If your usage is high, SECO offers several energy-efficiency tools to help you identify energy wasters. Take the Home Energy Assessment to receive a detailed email tailored to your home’s features and lifestyle. The energy-saving advice will provide low-cost ways to decrease your usage – and your electric bill.


To easily calculate how much energy your appliances, lighting, electronic devices, and other energy-using items in your home consume, use the Energy Estimator.


September 2021 Sunshine State Stats

Fall arrived in September 2021 and temperatures began to cool off slightly. Don’t get out your heavy jacket yet. Winter temperatures are still months away and daily highs are still hitting over 90 degrees.


September 2021 Sunshine State Stats temps


In September 2021, the highest daily temperature recorded was 95 degrees, which is 4 degrees lower than the highest recorded temp in August 2021. The lowest recorded temperature this month was 67 degrees, which 6 degrees lower than the lowest temp recorded in August 2021. Rainfall increased from last month by a very small amount to measure 4.9 inches and is below September’s average of 5.76 inches.


September is the peak of hurricane season, while the month was active with tropical storm and hurricane activity, Central Florida remained clear of named-storm activity. As a reminder, the Atlantic hurricane season runs through November 30. It is best to remain vigilant and prepared in the event a late-season tropical storm or hurricane turns our way before the end of the season.


For September 2021 the average temperature was 83 degrees, which is one degree higher than the average temperature in September 2020. The average high temperature in September 2021 was 91 degrees, and the average low temperature was 74.


Although the average monthly temperature and average low and high temperatures have decreased slightly from August 2021, daily temperatures are still warm. Members may notice their energy usage for September 2021 will be similar to their usage from August 2021. Warm daily temperatures and Florida’s humidity mean HVACs will run for longer periods of time and more frequently to keep the temperatures cool inside. Daily temperature fluctuations also increase HVAC usage.


October forecast:


The October forecast shows a slight cool down in daily high temperatures to the high 80s and low 90s. Lows will be in the high 60s and low 70s. The rainy season is coming to a close, the best chance for rain is the possibility of scattered thunderstorms that bring lightning and wind during the first half of the month.


Take the bite out of damaging surges and spikes with SECO Energy’s Surge MitiGator surge protection. Our meter-based surge arrester protects large appliances by reducing surges BEFORE they enter the meter. Learn more about the Surge MitiGator.


To check historical usage, log into SmartHub to view past bills and consumption charts. If your usage is high, SECO offers several energy-efficiency tools to help you identify energy wasters. Take the Home Energy Assessment to receive a detailed email tailored to your home’s features and lifestyle. The energy-saving advice will provide low-cost ways to decrease your usage – and your electric bill.


To easily calculate how much energy your appliances, lighting, electronic devices, and other energy-using items in your home consume, use the Energy Estimator.


August 2021 Sunshine State Stats

Hot summer temperatures continued in August 2021 as the highest daily temperature recorded was 99 degrees. The lowest recorded temperature for the month was 73 degrees. Rainfall decreased from last month to measure 4.8 and is below August’s average of 7.76 inches.


August 2021 Sunshine State Stats temps


During August’s 31 days, 24 of those reached a high temp of over 90 degrees. Because of the increased temperatures, members will likely notice an increase in their August electric usage.


For August 2021 the average temperature was 85 degrees, which is one degree higher than the average temperature in August 2020. The average high temperature in August 2021 was 93 degrees, and the average low temperature was 77.


Both the average monthly temperature and average low and high temperatures have increased from July 2021. Again, members will likely see an increase in their energy usage for August 2021. Hotter temperatures and increased humidity mean HVACs will run for longer periods of time and more frequently to keep the temperatures cool inside. Daily temperature fluctuations also increase HVAC usage.


September forecast:


September is the peak of hurricane season. The Old Farmer’s Almanac predicts a tropical storm threat September 8 – 12. Daily highs will reach into the 90s with lows in the 70s with the chance of scattered thunderstorms that bring rain, lightning and wind during the middle of the month.


Take the bite out of damaging surges and spikes with SECO Energy’s Surge MitiGator surge protection. Our meter-based surge arrester protects large appliances by reducing surges BEFORE they enter the meter. Learn more about the Surge MitiGator. In September, members enrolled in surge protection are entered in a drawing to win a portable generator each month. Enroll today for the chance to win!


To check historical usage, log into SmartHub to view past bills and consumption charts. If your usage is high, SECO offers several energy-efficiency tools to help you identify energy wasters. Take the Home Energy Assessment to receive a detailed email tailored to your home’s features and lifestyle. The energy-saving advice will provide low-cost ways to decrease your usage – and your electric bill.


To easily calculate how much energy your appliances, lighting, electronic devices, and other energy-using items in your home consume, use the Energy Estimator.


July 2021 Sunshine State Stats

Mother Nature increased both the daily temperatures and precipitation in July 2021. The highest daily temperature measured in at 98 degrees, and the lowest temperature came in at 72 degrees. Tropical Storm Elsa brought heavy rain, winds, tornado warnings and watches to our area on July 6th and 7th for our first test of the 2021 Atlantic hurricane season.


July 2021 Sunshine State Stats temps


July was seasonably hot with afternoon thunderstorms occurring almost daily. During July’s 31 days, 24 of those reached a high temp of over 90 degrees. Because of the increased temperatures, members will likely notice an increase in their July electric usage.


For July 2021 the average temperature was 83 degrees, which was the same as the average temperature in July 2020. The average high temperature in July 2021 was 91 degrees, and the average low temperature was 75. Total precipitation this month measured 8.4 inches compared to 4.6 inches in July last year.


Both the average monthly temperature and average low and high temperatures have increased from June 2021. Again, members will likely see an increase in their energy usage for July 2021. Hotter temperatures and increased humidity mean HVACs will run for longer periods of time and more frequently to keep the temperatures cool inside. Daily temperature fluctuations also increase HVAC usage.


August forecast:


The threat of tropical storms and hurricanes increases as we enter August, and the threat peaks in September. Expect rain – our rainy season continues through September with daily thunderstorms that bring rain, lightning and wind. Daily highs will reach 90 degrees and above with lows in the 70s.


Take the bite out of damaging surges and spikes with SECO Energy’s Surge MitiGator surge protection. Our meter-based surge arrester protects large appliances by reducing surges BEFORE they enter the meter. Learn more about the Surge MitiGator. In August and September, members enrolled in surge protection are entered in a drawing to win a portable generator each month. Enroll today for the chance to win!


To check historical usage, log into SmartHub to view past bills and consumption charts. If your usage is high, SECO offers several energy-efficiency tools to help you identify energy wasters. Take the Home Energy Assessment to receive a detailed email tailored to your home’s features and lifestyle. The energy-saving advice will provide low-cost ways to decrease your usage – and your electric bill.


To easily calculate how much energy your appliances, lighting, electronic devices, and other energy-using items in your home consume, use the Energy Estimator.

June 2021 Sunshine State Stats

Precipitation in June 2021 was higher than average leading to a soggy but hot month. The highest daily temperature measured in at 94 degrees, and the lowest temperature came in at 67 degrees. While June 1, 2021, is the official start of Atlantic hurricane season, our area was left unscathed by tropical storms or hurricanes this month (though Elsa changed that in early July).


June 2021 Sunshine State Stats temperatures


June was also the official start of summer and the hot temperatures and daily afternoon thunderstorms have arrived. High temps reached over 90 degrees 16 days this month. Members will likely notice an increase in their June electric usage due to the higher temperatures during the day that stretch into the evening.


For June 2021 the average temperature was 82 degrees, which was the same as the average temperature in June 2020. The average high temperature was 90 degrees, and the average low temperature was 73. Total precipitation this month measured 8.6 inches compared to 6.1 inches in June last year. The average rainfall in June is 6.13 inches.


Again, members will likely see an increase in their energy usage for June 2021. Both the average monthly temperature and average low and high temperatures have increased from May 2021. Both the average temperature and the average low temperature are 4 degrees, and the average high is up 2 degrees. Hotter temperatures mean HVACs will run for longer periods of time and more frequently to keep the temperatures cool inside. Daily temperature fluctuations also increase HVAC usage. The highest daily temperature fluctuation in June was 24 degrees.


July forecast:


Florida’s rainy season continues into September with almost daily thunderstorms that bring rain, lightning and wind. Daily highs will reach 90 degrees and above with lows in the 70s.


Take the bite out of damaging surges and spikes with SECO Energy’s Surge MitiGator surge protection. Our meter-based surge arrester protects large appliances by reducing surges BEFORE they enter the meter. Learn more about the Surge MitiGator. In August and September, members enrolled in surge protection are entered in a drawing to win a portable generator each month. Enroll today for the chance to win!


To check historical usage, log into SmartHub to view past bills and consumption charts. If your usage is high, SECO offers several energy-efficiency tools to help you identify energy wasters. Take the Home Energy Assessment to receive a detailed email tailored to your home’s features and lifestyle. The energy-saving advice will provide low-cost ways to decrease your usage – and your electric bill.


To easily calculate how much energy your appliances, lighting, electronic devices, and other energy-using items in your home consume, use the Energy Estimator.

April 2021 Sunshine State Stats

Will the adage prove true? Let’s hope the above average April 2021 showers will bring May flowers. April 2021 brought both rain and hot temperatures to Central Florida. Temperatures reached as high as 90 degrees and as low as 45 degrees. The month ended with an eight-day streak of high temperatures that reached over 80 degrees. In total, 21 days in the month reached above 80 degrees and 2 of these days the temperature reached 90.


April 2021 Sunshine State Stats temps


Hotter temperatures are just over the horizon. Members may notice an increase in their April electric usage due to cooling needs increasing to combat hotter daily and nightly temps.


For April 2021 the average temperature was a comfortable 71 degrees, which is 4 degrees lower than the average temperature in April 2020. The highest recorded temperature was 90 degrees and the lowest recorded was 45 degrees. The average high temperature was 81 degrees, and the average low temperature was 61.


Average April rainfall is 2.8 inches, April 2021 was much higher at 6.08 inches. Comparatively, precipitation in April 2020 was lower at 2.92 which is closer to the normal average.


Again, members may see an increase in their energy usage for April 2021. Central Florida is entering into the late spring and summer months. Hotter temperatures mean HVACs will run for longer periods of time to keep the temperatures cool inside. Daily temperature fluctuations also increase HVAC usage. The highest daily temperature fluctuation in April was 28 degrees.


May forecast:


The forecast for May 2021 includes mostly sunny days with intermittent chances of daily thunderstorms. Expect highs in the 90s with lows in the high 60s to low 70s.


To check historical usage, log into SmartHub to view past bills and consumption charts. If your usage is high, SECO offers several energy-efficiency tools to help you identify energy wasters. Take the Home Energy Assessment to receive a detailed email tailored to your home’s features and lifestyle. The energy-saving advice will provide low-cost ways to decrease your usage – and your electric bill.


To easily calculate how much energy your appliances, lighting, electronic devices, and other energy-using items in your home consume, use the Energy Estimator.

March 2021 Sunshine State Stats

Spring officially arrived in Central Florida in March 2021. Temperatures fluctuated from the high 80s to the low to mid-40s. The month ended with an eight-day streak of high temperatures that reached into the 80s. In total, 18 days in the month reached above 80 degrees. Members may notice an increase in their March electric usage due to heating and cooling needs during the month.


March 2021 Sunshine State Stats temperatures


For March 2021 the average temperature was a comfortable 69 degrees, which is 5 degrees lower than the average temperature in March 2020. The highest recorded temperature was 89 degrees and the lowest recorded was 44 degrees. The average high temperature was 79 degrees, and the average low temperature was 59.


Rainfall for March 2021 was below the average of 4.03 inches with only 1.42 inches for the month. Precipitation in March 2021 is higher than last year’s total of only .23 inches.


Again, members may see an increase in their energy usage for March 2021. Central Florida is experiencing more days that reached highs of over 80 degrees. Daily temperature fluctuations mean members used their HVACs to cool their homes during the day and for heat after the sun went down. The highest daily temperature fluctuation was 26 degrees.


April forecast:


Expect sunny days in April 2021 with little chance of rain. The weather forecast calls for highs in the 80s and low 90s with lows in the 50s and 60s.


To check historical usage, log into SmartHub to view past bills and consumption charts. If your usage is high, SECO offers several energy-efficiency tools to help you identify energy wasters. Take the Home Energy Assessment to receive a detailed email tailored to your home’s features and lifestyle. The energy-saving advice will provide low-cost ways to decrease your usage – and your electric bill.


To easily calculate how much energy your appliances, lighting, electronic devices, and other energy-using items in your home consume, use the Energy Estimator.

February 2021 Sunshine State Stats

Central Florida weather in February 2021 included some of the lowest and highest temperatures of the 2020 – 2021 winter season. Residents donned heavy winter coats in the beginning of the month and flip-flops by month’s end. High temperatures reached 80 degrees or above 13 days in the month with low daily temperatures in the 30s and 40s. Members may notice an increase in their February electric usage due to heating and cooling needs during the month.


SECO Energy February 2021 Sunshine State Stats temps


For February 2021 the average temperature was a comfortable 66 degrees, which is the same average temperature in February 2020. The highest recorded temperature was 87 degrees and the lowest recorded was 36 degrees. The average high temperature was 76 degrees, and the average low temperature was 55.


Average rainfall in February is just under 3 inches. February 2021 rainfall was higher than average at 3.2 inches for the month. In February 2020, rainfall measured lower at 2.1 inches.


Again, members may see an increase in their energy usage for February 2021. Daily temperature fluctuations mean members used their HVACs to cool their homes during the day and for heat after the sun went down. The highest daily temperature fluctuation was 30 degrees.


March forecast:


The March 2021 forecast boasts beautiful Florida spring weather with high temperatures in the upper 70s to mid 80s and low temperatures in the upper 50s to mid 60s. Expect mostly sunny days with the best chance for rain early in the month.


The Old Farmer’s Almanac predicts the average temperature for March will be 69 degrees, which is 2 degrees above average. Rainfall is expected to be slightly below average.


To check historical usage, log into SmartHub to view past bills and consumption charts. If your usage is high, SECO offers several energy-efficiency tools to help you identify energy wasters. Take the Home Energy Assessment to receive a detailed email tailored to your home’s features and lifestyle. The energy-saving advice will provide low-cost ways to decrease your usage – and your electric bill.


To easily calculate how much energy your appliances, lighting, electronic devices, and other energy-using items in your home consume, use the Energy Estimator.

January 2021 Sunshine State Stats

January 2021 weather was a mix of hot and cold. Mother Nature kept us guessing with high daily temperatures in the 80s and low daily temps in the 30s. Members may notice an increase in their January electric usage due to heating and cooling needs during the month.


January 2021 Sunshine State Stats temps


For January 2021 the average temperature was a balmy 60 degrees, which is 4 degrees lower than the average temperature of 64 degrees in January 2020. Four days in the month reached 80 degrees or over, while two days dipped into the 30s. The highest recorded temperature was 82 degrees and the lowest recorded was 38 degrees. The average high temperature was 70 degrees and the average low temperature was 49.


Average rainfall in January is just over 3 inches. January 2021 rainfall was lower than average at only 1.04 inches for the month. In January 2020, rainfall measured less than .5 inches.


Again, members may see an increase in their energy usage for January 2021. Daily temperature fluctuations mean members used their HVACs to cool their homes during the day and for heat after the sun went down. The highest daily temperature fluctuation was 31 degrees.


February forecast:


The February 2021 forecast calls for high temperatures in the low to mid 70s and low temperatures to drop into the high 30s and low 40s. Temperatures may drop into freezing during the first week of the month. The best chance for rain is the first half of the month. Expect morning showers and partly cloudy days.


The Old Farmer’s Almanac predicts above-average temperatures for February with below-average rainfall.


To check historical usage, log into SmartHub to view past bills and consumption charts. If your usage is high, SECO offers several energy-efficiency tools to help you identify energy wasters. Take the Home Energy Assessment to receive a detailed email tailored to your home’s features and lifestyle. The energy-saving advice will provide low-cost ways to decrease your usage – and your electric bill.


To easily calculate how much energy your appliances, lighting, electronic devices, and other energy-using items in your home consume, use the Energy Estimator.