Sunshine State Stats, August 2018
August 2018 was similar on average to August 2017. The average temperature was 83°, while August of 2017 had an average temperature of 84°. The average high this year was 91 – just one degree lower than last year. Though it seemed like it rained every darn day, rainfall for August of 2018 was 4.88 inches compared to last August at 7.91 inches.
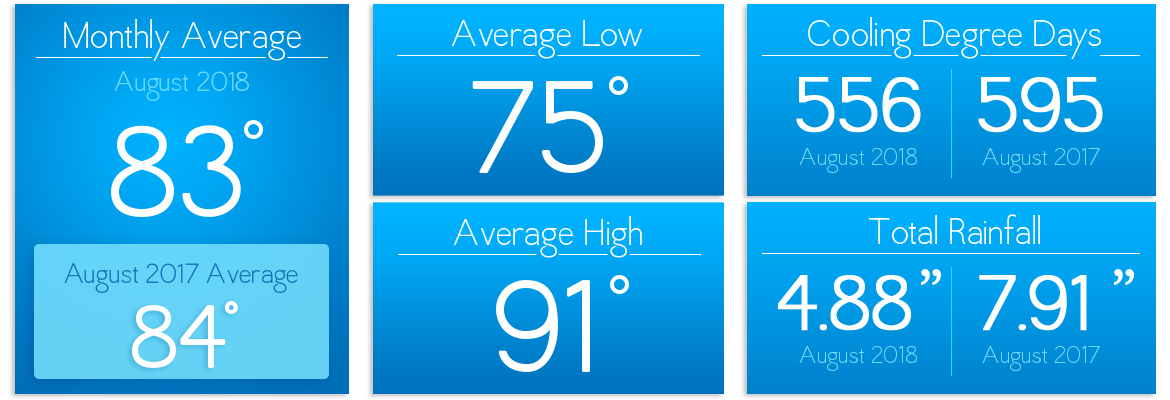
There were 556 cooling degree days and 0 heating degree days for August 2018, while last year there were 595 cooling degree days with 0 heating degree days. The Degree Days are based on how much warmer or cooler the average temperature at a particular location is than 65°F. In other words, if the average temperature is 60° degrees outside on a particular day, there are 5 Heating Degree Days for that day in that location.
September 2018 is… well… still hot with highs in the high 80s and low 90s. Rainfall is forecast to be heavier than normal compared to 2017. Thankfully, Fall is around the corner bringing cooler temperatures, allowing your air conditioners to get a much-needed break.
If you want to check historical usage, log into SmartHub to view past bills and charts. If your usage is high, SECO offers several energy-efficiency tools to help you identify energy wasters. Take the Home Energy Assessment to receive a detailed email tailored to your home’s features and lifestyle. The energy-saving advice will provide low-cost ways to decrease your usage – and your electric bill.
To easily calculate how much energy your appliances, lighting, electronic devices, and other energy-using items in your home consume, use the Energy Estimator. If you want a member of our Energy Services team to come to your home to perform a free energy audit, contact us today to book an appointment.