StormCenter logo

Archive

SECO News, September 2019

SECO News Duncan's Digest 2019


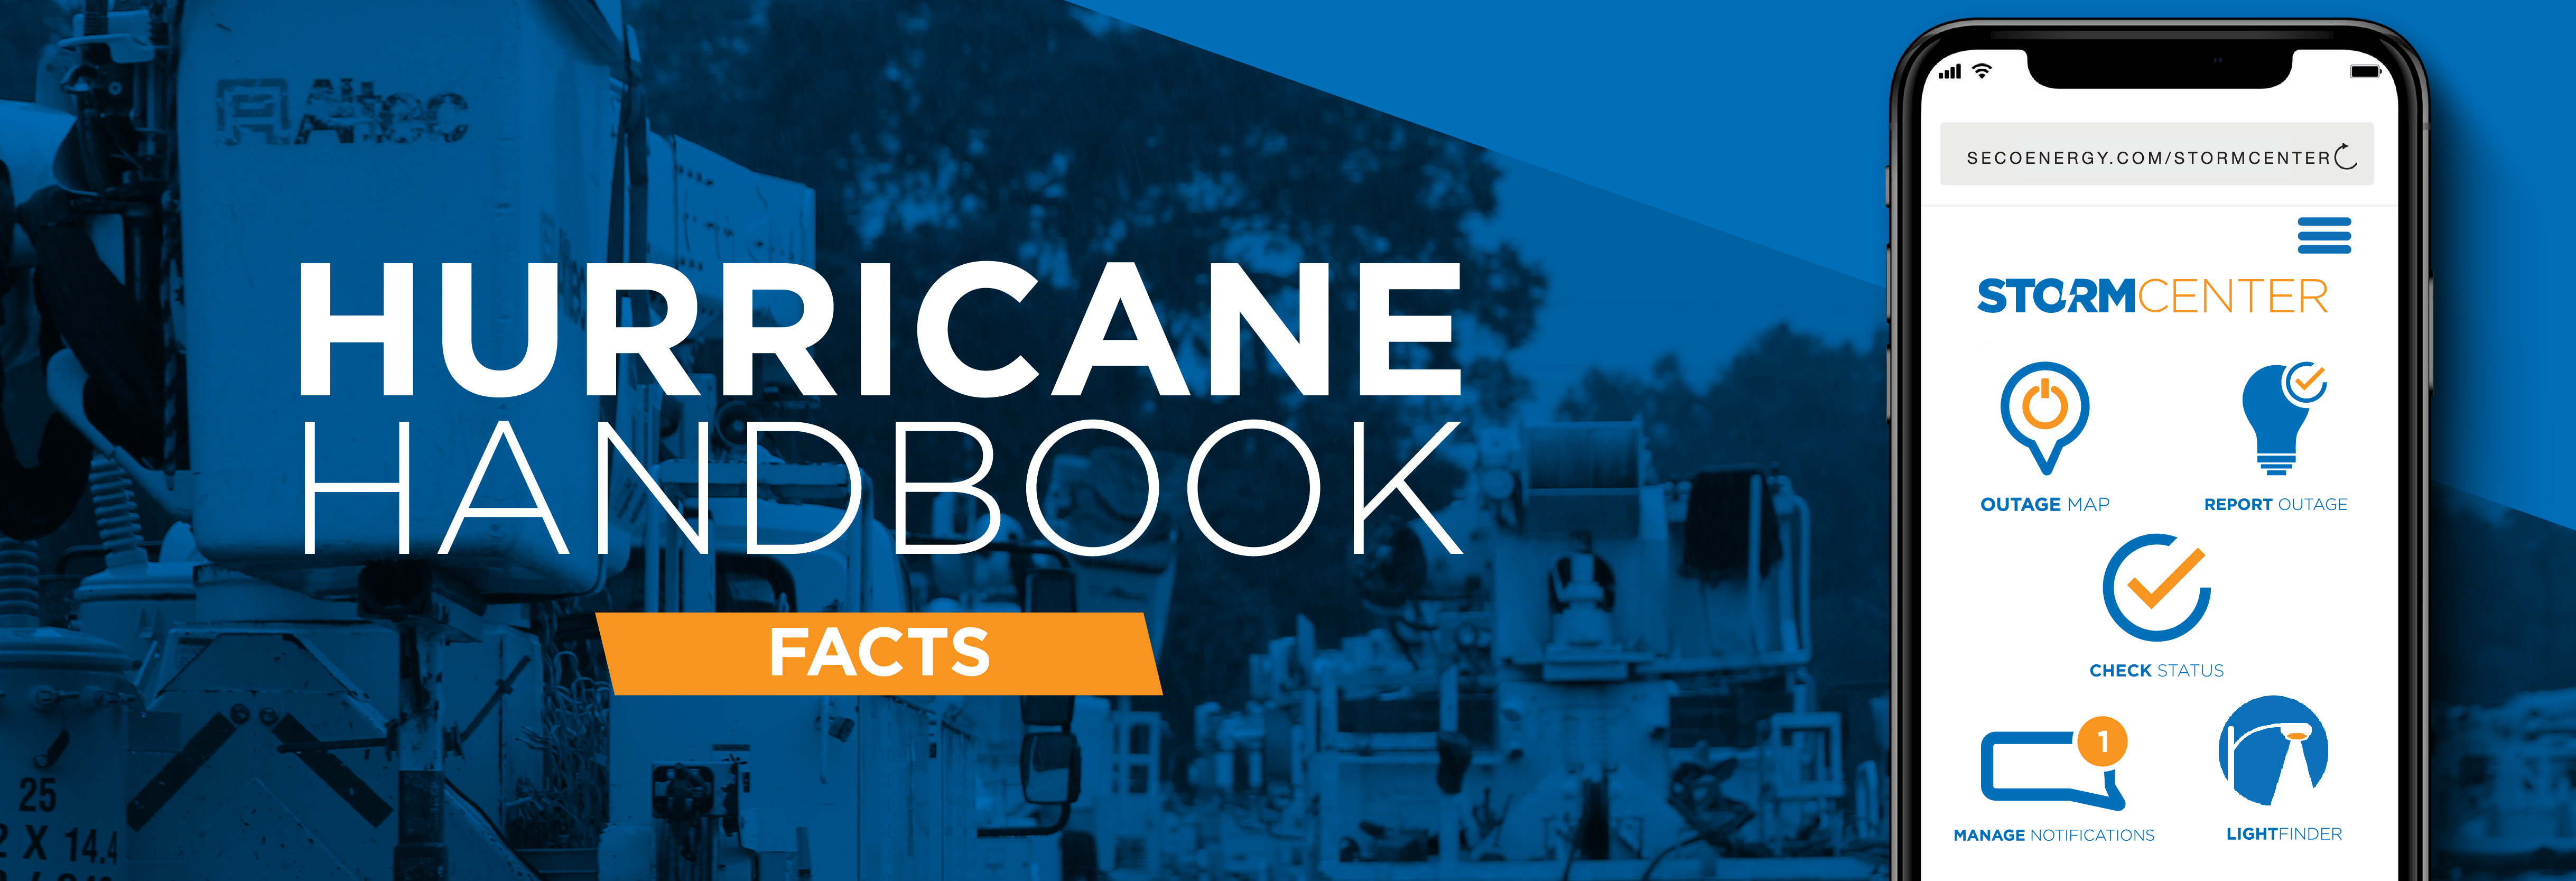
Welcome to our new Hurricane Handbook. Named storms can cause extended outages even for a system like SECO’s that is well built, constructed and maintained. To prepare for the worst, review our people/pets preparation checklists, outage notification enrollment instructions, Florida Special Needs Registry details, restoration priorities, damage assessment warnings and lessons on hunkering down. Learn about generator safety by to watch our newest video. For the chance to win an 8,000 watt Briggs Stratton portable generator, click on the website’s home page banner to register at SmartHub (SECO’s online account platform) by October 15. All members with SmartHub accounts as of October 15 will be entered in the drawing.


Sincerely,


Jim Duncan

Chief Executive Officer
SECO News September 2019 Hurricane Handbook

HURRICANE STRENGTH STATS


The Saffir–Simpson wind scale classifies hurricanes that exceed the intensities of tropical depressions and tropical storms into five categories distinguished by the intensities of sustained winds.


CAT 1 74 to 95 mph
CAT 2 96 to 110 mph
CAT 3 111 to 129 mph (major)
CAT 4 130 to 156 mph (major)
CAT 5 157 mph or higher (major)


Even tropical storms can cause significant damage and flooding. Most storm casualties are from drowning and not wind. Always heed weather warnings, evacuate as instructed and don’t drive into high water. Keep your family safe.


DISCONNECTING IN ADVANCE: MYTH OR FACT


Many years ago, it was a common practice for utilities to completely de-energize their electric systems ahead of a storm in an effort to proactively prevent damage during the storm. SECO Energy does not employ this practice.


RESTORATION PRIORITY – WHO’S FIRST?


SECO Energy provides world-class reliability to 200,000+ homes and businesses. Outages due to weather, vehicle accidents, equipment issues, animal or tree contact with lines result in utilities being unable to guarantee 100 percent uninterrupted electric service.


During emergency restoration with widespread damage, SECO Energy’s first responsibilities are shelters, hospitals, schools and government agencies like emergency ops centers, fire stations and law enforcement facilities. SECO’s next priority is large commercial accounts providing food, water and damage-recovery supplies. Feeders with the largest number of members served are next. Our goal is to restore service to the highest volume of members as quickly as possible.
 

SECO News September 2019 Before a Storm

FLORIDA’S SPECIAL NEEDS REGISTRY


Register with the Florida Division of Emergency Management at floridadisaster.org before a storm hits to receive county specific lifesaving information. If an evacuation or emergency is declared, you will receive important options from local emergency management by signing up with your county’s emergency alert notifications (Alert Citrus, Alert Hernando, Alert Marion, Alert Levy, Alert Lake, Alert Sumter, Alert Pasco). Visit your county’s Emergency Operations online to sign up for the alerts you would like to receive.


MEMBERS USING MEDICAL EQUIPMENT


Residential members’ accounts coded as having medically necessary service are not the first priority after a storm with widespread damage. These members should prepare before storm season and anticipate the possibility of extended outages that could last for days. If you are dependent on electric-powered medical equipment, register with your county emergency management center’s Special Needs Registry. Most important, purchase a generator for use during power outages.


OUTAGE NOTIFICATION PREFERENCES


Visit us online and click StormCenter at the top right. Scroll down and select “Manage Notifications.” Log in with your account number or phone number. View and update your preferences for email, text or voice notifications. Set do not disturb parameters.


ADD STORMCENTER APP TO MOBILE DEVICE HOME SCREEN


On our website, click StormCenter. Select the Outage Map tile. Tap the Share Arrow. Select “Add to Home Screen” from options.


BOOKMARK DAILY RESTORATION PLAN MAP


SECO utilizes this interactive map when the Emergency Response Plan is activated. This map is different from the StormCenter outage map. The Restoration Plan Map displays the areas where crews are working each day and helps you know when you can reasonably expect service restoration. Access this map from the website home page banner during emergencies.


SUPPLY STOCK UP – SEVEN DAYS
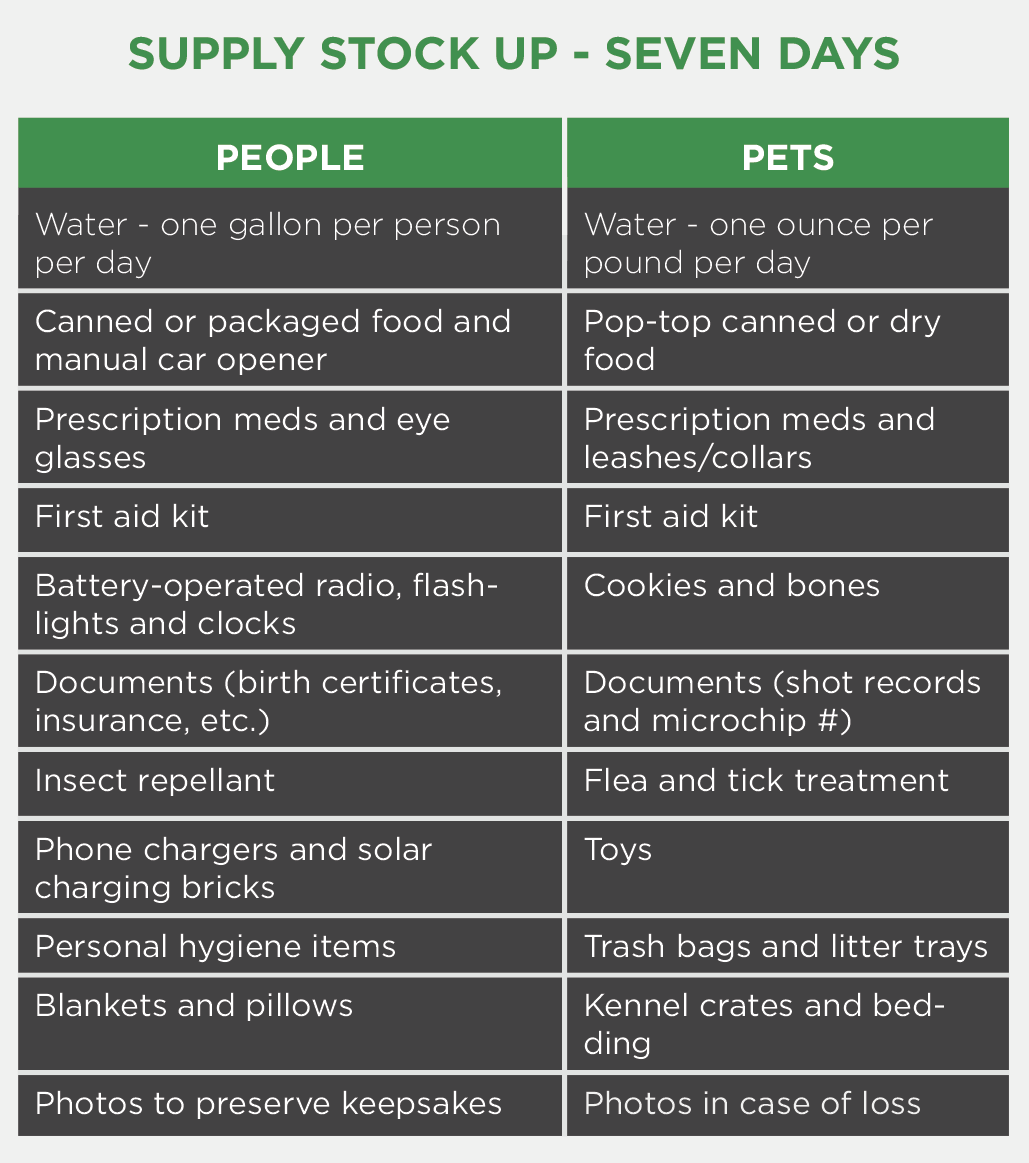
 

September 2019 SECO News Supply Stock Up - Seven Days


Turn your refrigerator and freezer to the coldest settings. Only open refrigerator and freezer doors when necessary. Move freezable foods into the freezer. A refrigerator will keep food cold for about four hours after a power outage; a full freezer will keep food frozen for about 48 hours. Move your emergency supplies into a secure room with no windows or fireplaces.
 

SECO News September 2019 During a Storm

HUNKER DOWN – STAY INFORMED


During the storm, remain indoors and prepare to wait out the weather safely. Stay informed with a battery-powered weather radio. Be ready to re-locate your family and pets to a secure location in your home with no windows or fireplaces. Break out the family board games and preserve your phone’s battery power.


NO RESTORATION IN WINDS ABOVE 35 MPH

SECO Energy invests heavily in an aggressive vegetation management program to keep our overhead lines clear. Still, severe storms with high winds create tree-related outages. Once sustained wind speeds reach 35 mph, it is not safe to use bucket trucks or perform restoration. When wind speeds have fallen below 35 mph, SECO deploys employees and mutual aid to begin restoration efforts.


TORNADOES – WATCH VS WARNING

Tornadoes are vertical funnels of rapidly spinning air often referred to as nature’s most violent storm. Winds can reach speeds of 300 mph. Tornadoes are commonly associated with severe thunderstorms. It is extremely likely that during a hurricane you may experience a tornado.


TORNADO WATCH: Tornadoes are possible in/near the watch area. Check supplies and your safe room. Be ready to act fast if a warning is issued or you suspect a tornado is approaching.


TORNADO WARNING: A tornado has been sighted or indicated by weather radar. There is imminent danger to life and property. Go immediately to your safe room, interior room or hallway. Avoid windows.


IF YOU EXPERIENCE A TORNADO, stay clear of downed power lines and damaged buildings. Treat downed lines as if they are energized.
 

SECO News September 2019 Electric System 101


HIGH VOLTAGE TRANSMISSION LINES: These supply power to SECO’s 48 substations which serve 200,000+ homes and businesses. If a storm damages a transmission line, substations also lose power. Much of the transmission serving SECO’s substations is owned/operated by Duke Energy. If Duke’s lines are down, SECO Energy cannot restore power to our members until these lines are repaired.


DISTRIBUTION SUBSTATION: A substation serves thousands of members. Our line crews inspect substations to determine if problems stem from transmission lines feeding into the substation, the substation itself, or if problems exist further down the feeders and lateral lines.


FEEDER DISTRIBUTION LINES: When problems cannot be isolated at a substation, distribution lines are inspected. These larger lines originate from substations and distribute power to large groups of members in our service area.


LATERAL DISTRIBUTION LINES: These smaller lines deliver power to transformers, either mounted on poles or placed on pads for underground service and deliver power to smaller groups of members in less densely populated areas.


SERVICE LINES: The service line is the line between a transformer and your residence or business.
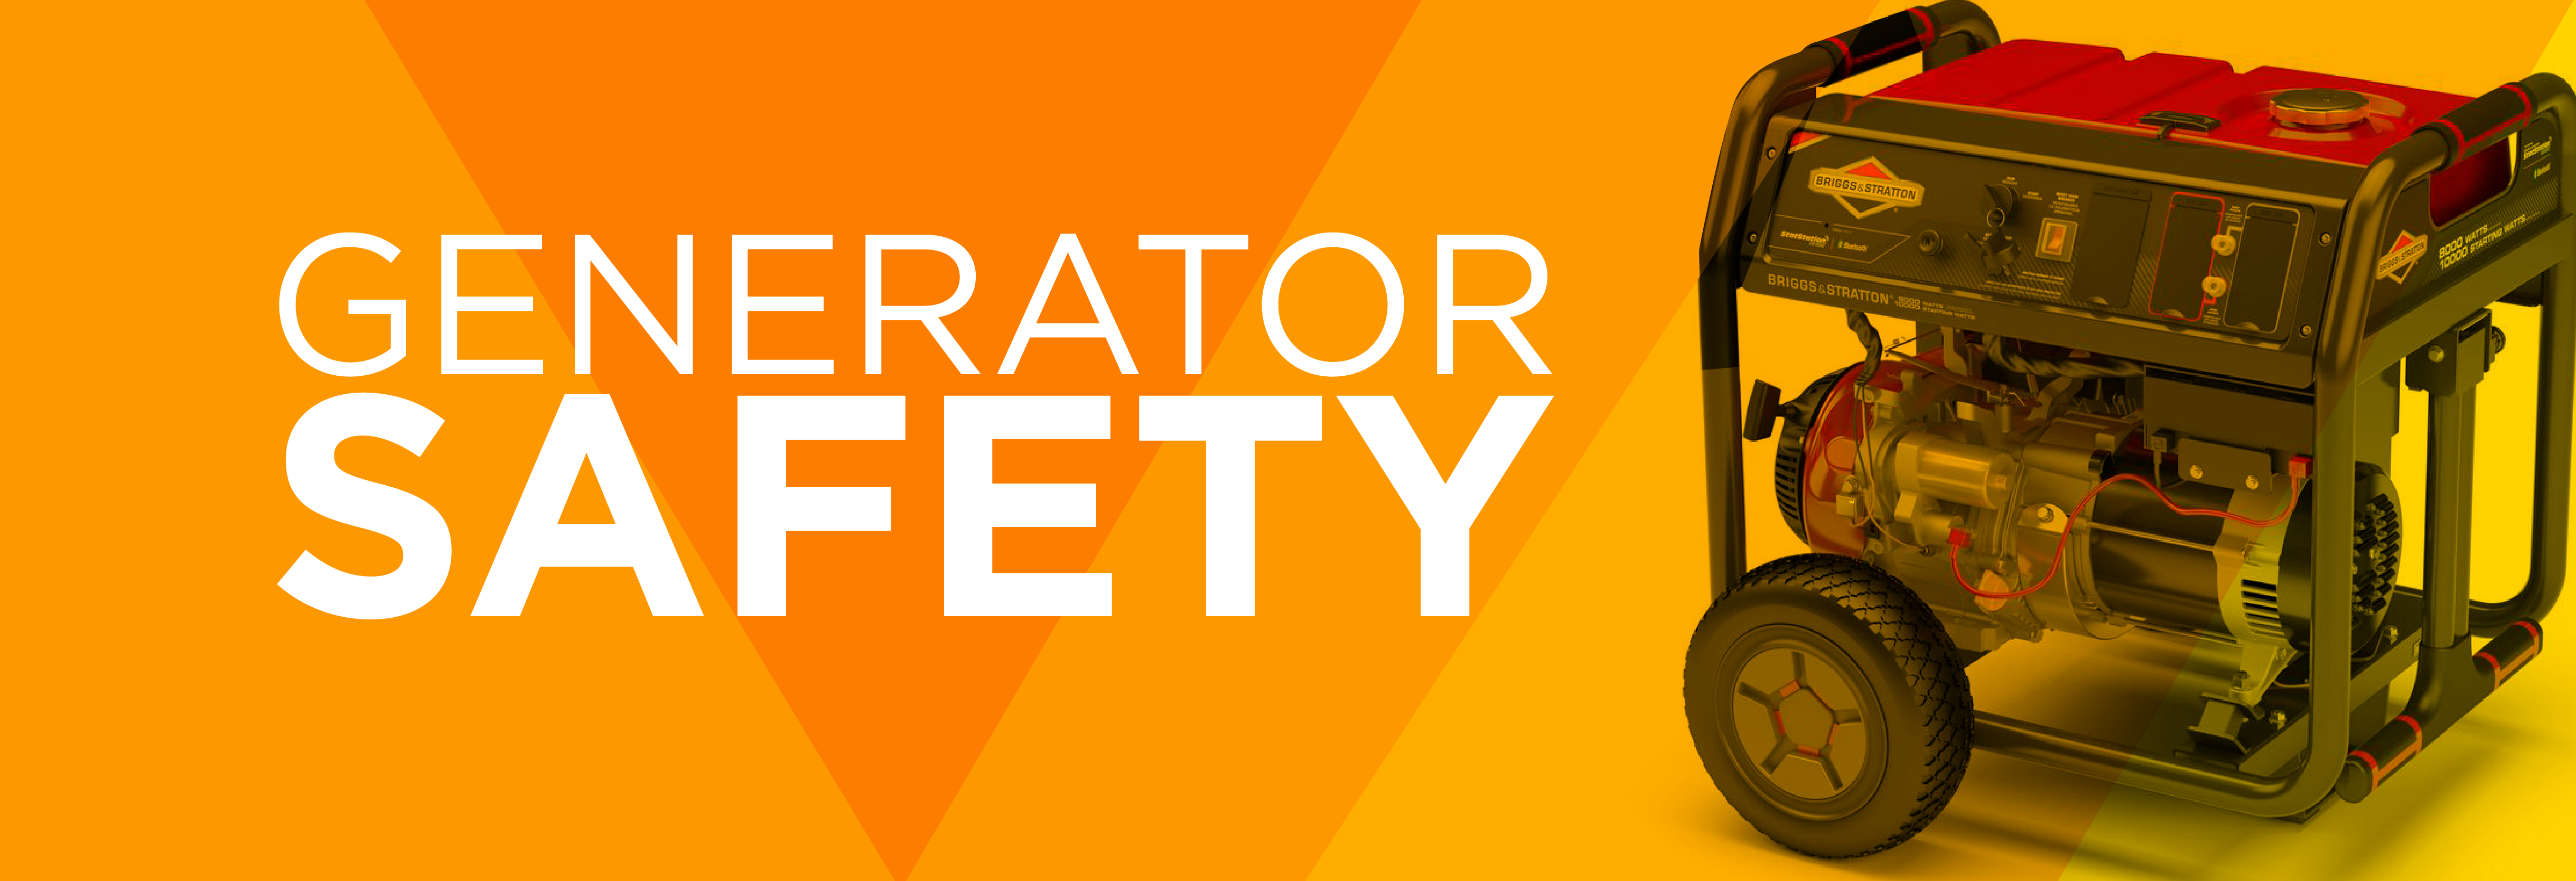
 

SECO News September 2019 Generator Safety

STATIONARY GENERATOR: A permanently affixed generator installed by a licensed technician with an approved disconnect and transfer switch that isolates your home’s circuits from SECO Energy and eliminates the risk of backfeeding on utility lines.


PORTABLE GENERATOR: A common type of generator that does not require a licensed technician to install. Use extension cords to plug certain appliances into the outlets on the generator. Never operate indoors.


More lifesaving information on generator safety can be found on our website. Click on the generator banner for a chance to win a new 8,000 watt Briggs Stratton portable generator. Enter by October 15.
 

SECO News September 2019 After a Storm
RETURNING HOME-ASSESS DAMAGE


If your home or business is damaged and it is safe, turn off your main breaker to prevent fires. If appliances are wet, turn off each appliance’s main breaker. Once you’ve turned the breaker off, unplug the wet appliance.


If fuses blow when your power is restored, turn off the breakers and contact a licensed electrician. Always call an electrician or an appliance repair service if in doubt.


DEBRIS CLEANUP


Once the storm has passed, ensure that you and your home are safe while power is being restored. Do not make piles that interfere with utility trucks. Keep piles away from power lines, transformers and downed lines for safety and speedy restoration. Call your county’s emergency operations center if public roadway debris prevents utility and emergency vehicle access.
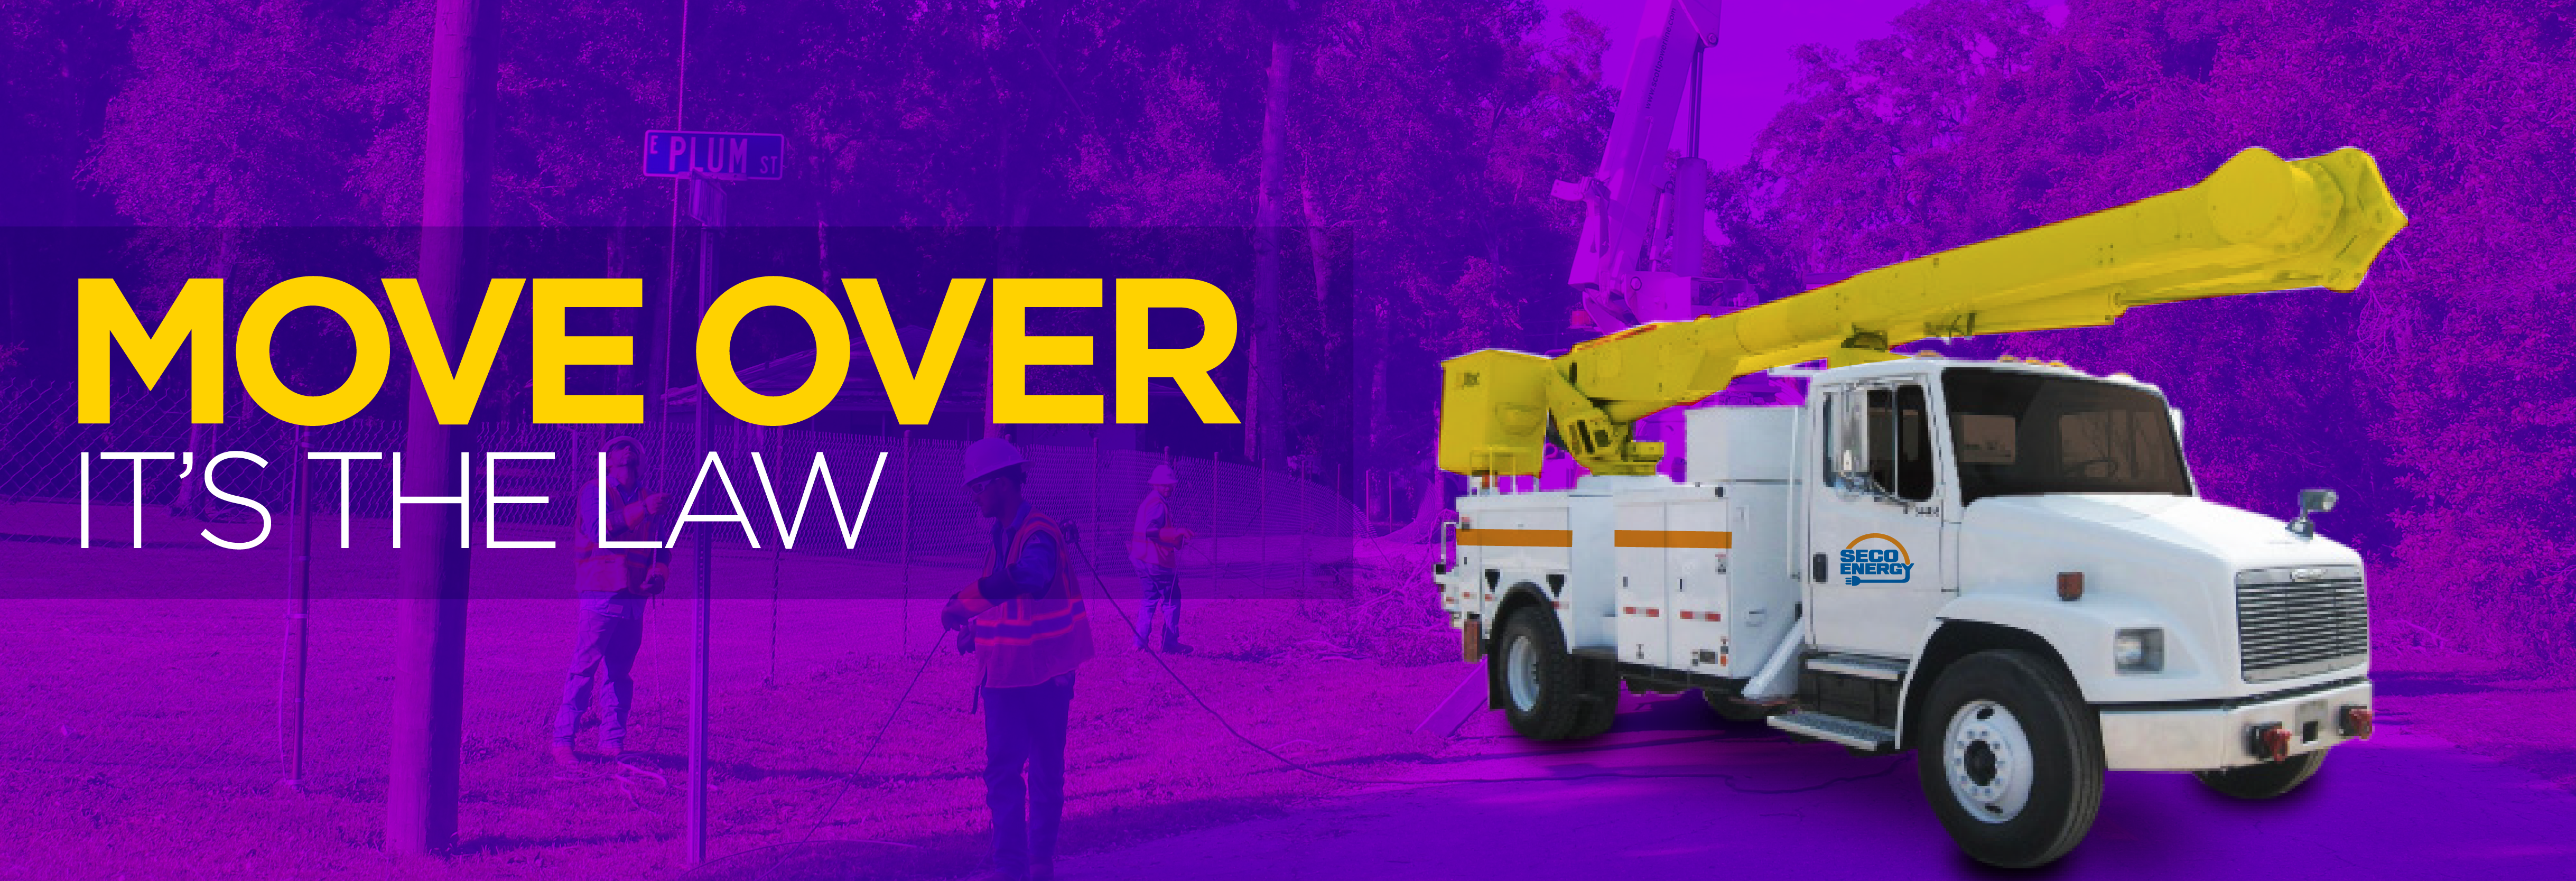
 

SECO News September 2019 Move Over It's the Law


• Move over a lane for law enforcement, emergency, sanitation, utility vehicles and tow trucks.
• If you can’t move over, slow to 20 mph less than the posted speed limit.
• If the posted speed limit is 20 mph or less, slow down to 5 mph.


#MoveOverFL


Read the full September 2019 SECO News online.
SECO News, June 2019

DUNCAN’S DIGEST


Atlantic hurricane season makes its formal appearance on June 1 and ends November 30. In early May, however, the National Hurricane Center (NHC) was already tracking its first tropical disturbance in the Atlantic. NHC, a part of NOAA, at the time this publication went to print, had not released its official forecast.

May 2018 SECO News Duncan's Digest

The Weather Channel 2019 outlook calls for a total of 14 named Atlantic storms, seven hurricanes and three “major” hurricanes. That forecast is slightly above the 30-year average of 12 named storms, six hurricanes and three major hurricanes. A major hurricane is a Category 3 or stronger which means winds greater than 111 mph.


Unfortunately, no forecast can accurately predict the future. The lifesaving approach is to expect the unexpected and prepare in advance for the possibility of a power outage. Gather your hurricane supplies now. Water and plywood sell out when storms threaten. It’s essential to stock non-perishable food to sustain each family member for at least three days. If you need guidance, view SECO’s Emergency Preparation Checklist online.


Whether you plan to evacuate or stay put during a major event, enroll in outage notifications through StormCenter. Choose email, voice or text message – or all three. Take a tour of the outage map. Search for and bookmark your address. Create a SECO Energy StormCenter icon on the home screen of your smartphone or tablet.


We’ve added a new StormCenter feature. You can now check the status of a reported power outage. Visit StormCenter, click on “Check Status.” Input your last name and house number, account number or phone number on record.


StormCenter provides updates that include the time the outage began, estimated restoration time, crew status, cause if identified and when the outage was restored.


SECO has developed one of the nation’s most comprehensive Emergency Restoration Plans to respond to major storm damage. Restoring service to the largest number of members in the quickest amount of time is our goal, but with required priorities for shelters, schools, hospitals and government buildings.


If you or a family member have special needs, visit www.FloridaDisaster.org to locate your county and join the statewide Special Needs Registry. Other valuable resources for emergency planning are the National Weather Service and the American Red Cross.


Don’t be caught unprepared for the 2019 Atlantic hurricane season. SECO Energy is StormReady and equipped to respond quickly to outages affecting members. We are here for you. It is our privilege to serve your family’s energy needs.


Sincerely,


Jim Duncan

Chief Executive Officer


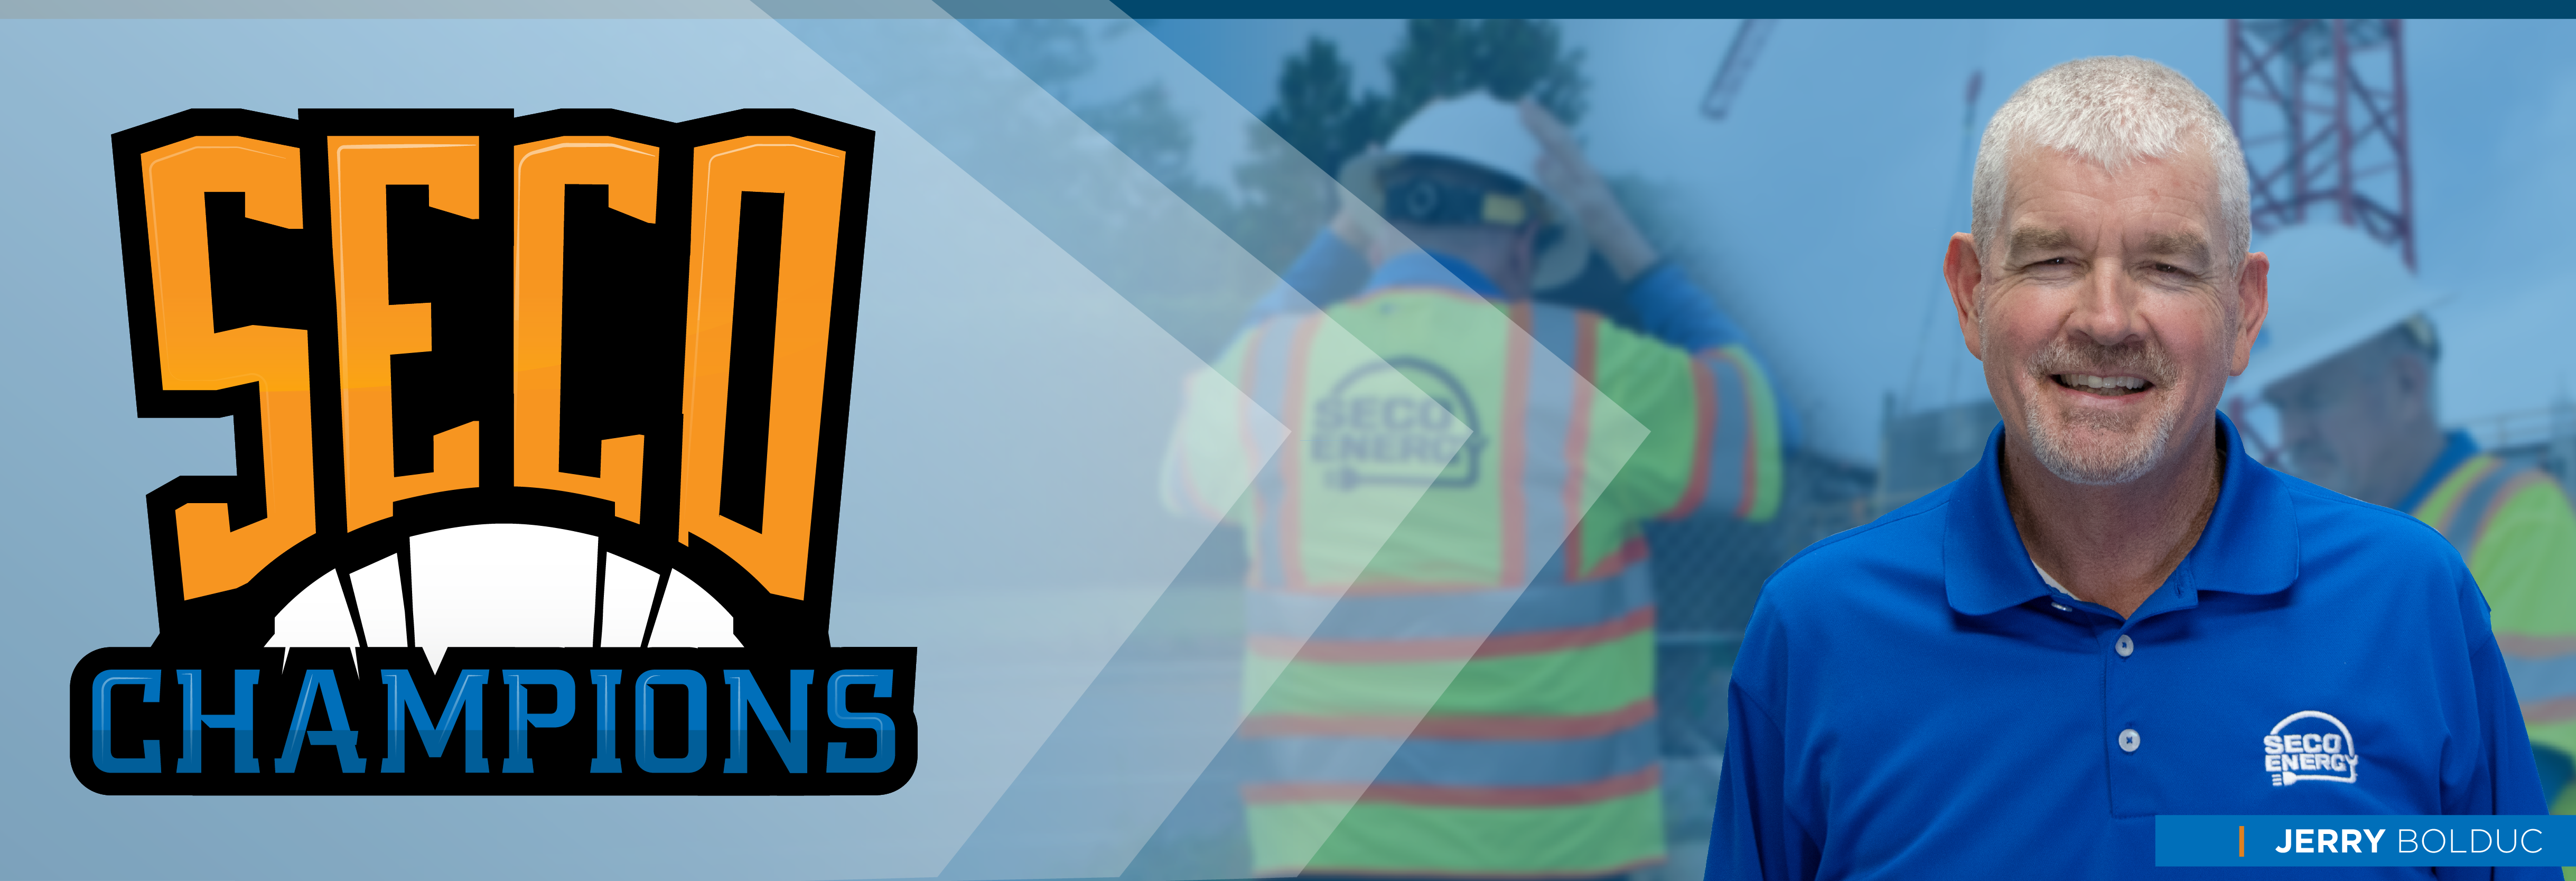
SECO CHAMPIONS JERRY BOLDUC JUNE 2019

Meet SECO Champion Jerry Bolduc – an example of our 400+ SECO Champion employees. Jerry is dedicated to providing exceptional service to members, co-workers and communities.


JERRY BOLDUC – LEAD PROJECT ENGINEER


LENGTH OF SERVICE – 14 YEARS


“SECO is amazing.”


SECO Champion Jerry Bolduc is a Lead Project Engineer at our SECO Headquarters. Before working at SECO, Jerry was employed by a large investor-owned utility. As a SECO member and an employee, he appreciates the cooperative difference in service that SECO offers members. During the three back-to-back hurricanes in 2004, Jerry assessed damaged areas and directed contract crews across the service territory. He was amazed by SECO’s storm response and the efficiency and organization shown during major restoration efforts. Originally from Canada, Jerry moved to Central Florida 20 years ago. He has participated in Ironman Triathlon Events including Escape from Alcatraz where he swam with sharks in San Francisco Bay. Jerry enjoys working in the field in sunny Florida (no snow) and is proud to be a SECO member, too.

SECO News HVAC Tune-Up and Filter Change June 2019

HVAC TUNE-UP AND FILTER CHANGE


Summer heat is quickly approaching. Weather.com predicts June through August temperatures will be above average in our area. Before your HVAC system begins its summer workout, schedule a tune-up with a reputable HVAC technician.


The technician should thoroughly inspect your HVAC to ensure it’s in good running condition. The system may need to be cleaned or serviced. Preventative maintenance is easier on the wallet than major repairs down the road. A well-tuned HVAC runs more efficiently, uses less energy and saves on cooling and heating costs.


Is it time to change your HVAC filter? A clean HVAC filter also helps your system run efficiently. Follow the manufacturer’s guidelines and change filters as recommended.

Power Line Safety June 2019 SECO News

POWER LINE SAFETY


Downed power lines are a safety hazard. Car accidents involving power poles, trees taking down a line or poles broken by heavy wind or rain have the potential to bring us too close to electric lines.


Electric energy can burn, shock, injure or kill you. Never assume a power line is safe to touch. Always assume a power line is live and has the ability to harm you. Children are especially curious and may knowingly or unknowingly approach a downed line. Talk with your kids and grandkids about the dangers of downed power lines.


Warn children to never play near or on substation fencing. Do not climb trees near power lines or allow kites, toy planes or balloons to touch power lines. Don’t release helium balloons at a birthday party or other celebration. These can tangle in lines or become deadly for Florida wildlife.


If you see a downed line, stay away and warn others away as well. Call 911 immediately to report the downed line.

SECO News June 2019 Relay For Life 6th Annual Golf Tournament

RELAY FOR LIFE – 6TH ANNUAL GOLF TOURNAMENT


Thank you to all players, sponsors and employees who participated in SECO Energy’s 6th Annual Relay For Life Golf Tournament “Tee-Up for a Cure” at Arlington Ridge Golf Club in Leesburg on Saturday, May 4th. Players enjoyed 18-holes of golf, chance to win door prizes and fellowship.


The Relay For Life Golf Tournament sponsored by SECO raised $16,600 for the American Cancer Society.


SECO and its employees are long-time supporters of the American Cancer Society and its premier annual Relay For Life events. Join SECO and its Commitment to Community by partnering with your not-for-profit cooperative on a virtual SECO Relay For Life team.


Join a SECO Energy team by visiting Relay.ACSevents.org and look for “Find a Participant or Team” and choose “Team.” Enter team name: “SECO Energy” and click “Search.” Choose a local Relay event and virtually join Team SECO and the American Cancer Society in the fight against cancer.


Read the full June 2019 SECO News online.
Sunshine State Stats, March 2019

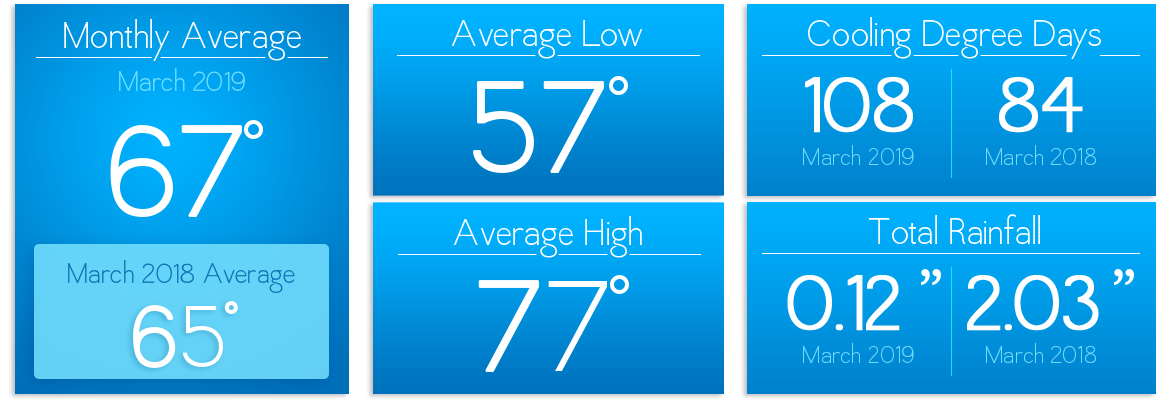
March 2019 was slightly warmer than March 2018. The average high temperature was 77 – one degree hotter than last year. Rainfall for March of 2019 was 0.12 inches compared to last March at 2.03 inches.

Sunshine State Stats breakdown March 2019

Based on data from the Leesburg weather station, April’s average high will heat up to the mid 80s, and the average historical low is 58 degrees. This variance could mean toggling between cooling your home in the day and heating it at night as temperatures drop. That said, if you haven’t changed your HVAC filter since last year, now is a good time to do so. It’s also a good time to have a qualified technician perform a health check on your system.


April rainfall is forecast to be heavier than normal compared to 2018. Warmer weather is right around the corner, so remember that every degree above 78 degrees on your thermostat will save you 6%-8% on your cooling costs.


If you’re interested in the HDDs and CDDs, there were 108 cooling degree days and 62 heating degree days for March 2019, while last year there were 84 cooling degree days with 67 heating degree days. The Degree Days are based on how much warmer or cooler the average temperature at a particular location is than 65°F. In other words, if the average temperature is 60° degrees outside on a particular day, there are 5 Heating Degree Days for that day in that location.


If you want to check historical usage, log into SmartHub to view past bills and charts. If your usage is high, SECO offers several energy-efficiency tools to help you identify energy wasters. Take the Home Energy Assessment to receive a detailed email tailored to your home’s features and lifestyle. The energy-saving advice will provide low-cost ways to decrease your usage – and your electric bill.


To easily calculate how much energy your appliances, lighting, electronic devices, and other energy-using items in your home consume, use the Energy Estimator. If you want a member of our Energy Services team to come to your home to perform a free energy audit, contact us today to book an appointment.


** Past weather data sourced from Leesburg Airport weather station.

Sunshine State Stats, January 2019

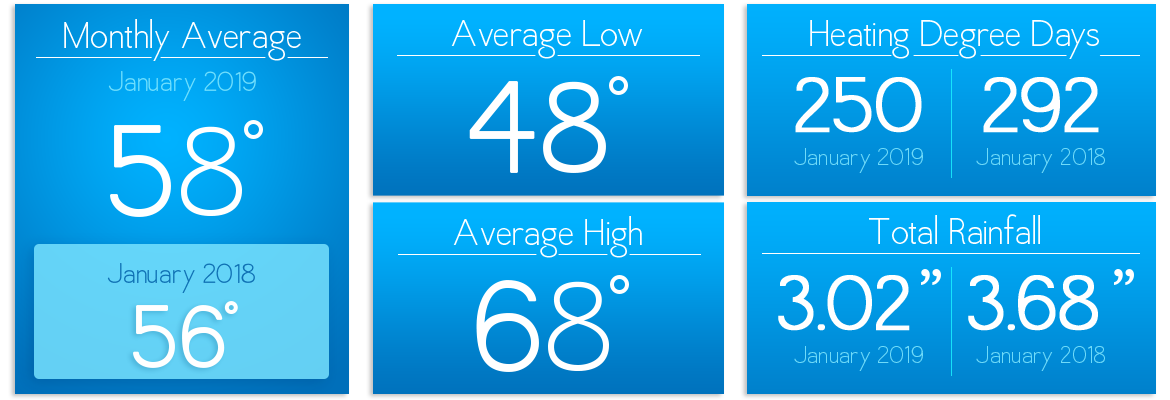
January 2019’s average high was 68° and the average low was 48° – a couple of degrees warmer than last January. January’s average temperature was 58°, while January of 2018 had an average temperature of 56°. Rainfall for January of 2019 was 3.02 inches compared to last January at 3.68 inches.


January 2019 Sunshine State Stats breakdown


Based on data from the Leesburg weather station, February’s average high will hit around 71° and the average low is 49°. Those averages may cause residents to run heating units overnight and to switch to cooling in the afternoons. Based on the current forecast, Central Florida residents will see some afternoon highs in the low to mid 80s in mid-February. That said, if you haven’t changed your HVAC filter since last year, now is a good time to do so. It’s also a good time to have a qualified technician perform a health check on your system – well before the heat of summer is upon us.


Rainfall is forecast to be heavier than normal compared to 2018. For those with heat pumps, raise the thermostat setting no more than 1-2 degrees at a time when heating is being used to prevent back-up heat strips from operating. Heat strips can cost up to 5 times more per hour.


There were 27 cooling degree days and 250 heating degree days for January 2019, while last year there were 29 cooling degree days with 292 heating degree days. The Degree Days are based on how much warmer or cooler the average temperature at a particular location is than 65°F. In other words, if the average temperature is 60° degrees outside on a particular day, there are 5 Heating Degree Days for that day in that location.


If you want to check historical usage, log into SmartHub to view past bills and charts. If your usage is high, SECO offers several energy-efficiency tools to help you identify energy wasters. Take the Home Energy Assessment to receive a detailed email tailored to your home’s features and lifestyle. The energy-saving advice will provide low-cost ways to decrease your usage – and your electric bill.


To easily calculate how much energy your appliances, lighting, electronic devices, and other energy-using items in your home consume, use the Energy Estimator. If you want a member of our Energy Services team to come to your home to perform a free energy audit, contact us today to book an appointment.

Sunshine State Stats, December 2018

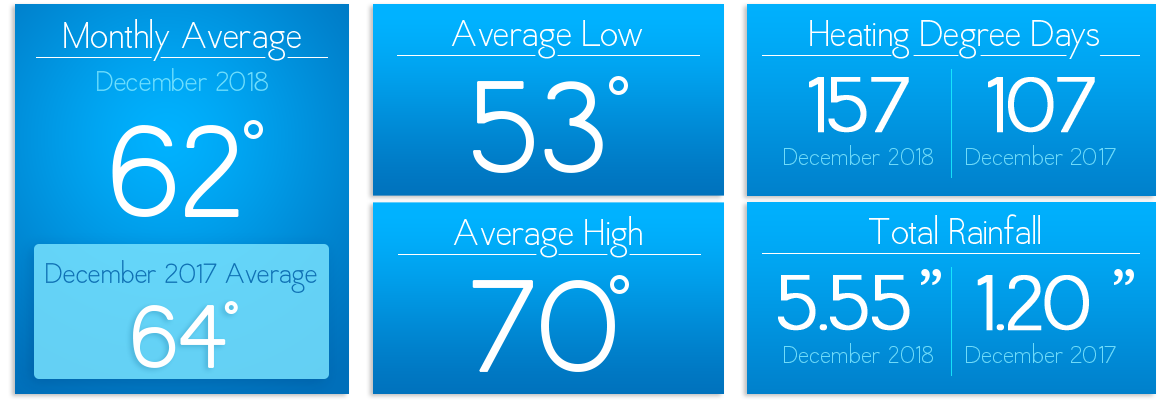
December 2018 was chilly compared to December 2017. The average temperature was 62°, while December of 2017 had an average temperature of 64°. The average high in December 2018 was three degrees cooler than 2017. This December also saw heavier precipitation. Rainfall for December 2018 was 5.55 inches compared to last December at 1.20 inches.


SECO Energy Sunshine State Stats December 2018 breakdown


There were 62 cooling degree days and 157 heating degree days for December 2018, while last year there were 81 cooling degree days with 107 heating degree days. The Degree Days are based on how much warmer or cooler the average temperature at a particular location is than 65°F. In other words, if the average temperature is 60° degrees outside on a particular day, there are 5 Heating Degree Days for that day in that location.


January 2019 is forecast to be somewhat the same as last January and is still Central Florida’s coldest month of the year. Our local forecast calls for lows in the 40s for at least sixteen nights in January. Be sure you’ve changed your heating unit’s air filter and have had the unit serviced by a qualified technician. Rainfall is forecast to be heavier than normal so keep an umbrella handy.


For those with heat pumps, raise the thermostat setting no more than 1-2 degrees at a time when heating is being used to prevent back-up heat strips from operating. Heat strips can cost up to five times more per hour in energy use.


If you want to check historical usage, log into SmartHub to view past bills and charts. If your usage is high, SECO offers several energy-efficiency tools to help you identify energy wasters. Take the Home Energy Assessment to receive a detailed email tailored to your home’s features and lifestyle. The energy-saving advice will provide low-cost ways to decrease your usage – and your electric bill.


To easily calculate how much energy your appliances, lighting, electronic devices, and other energy-using items in your home consume, use the Energy Estimator. If you want a member of our Energy Services team to come to your home to perform a free energy audit, contact us today to book an appointment.


** Past weather data sourced from Leesburg Airport weather station. 


Sunshine State Stats, October 2018

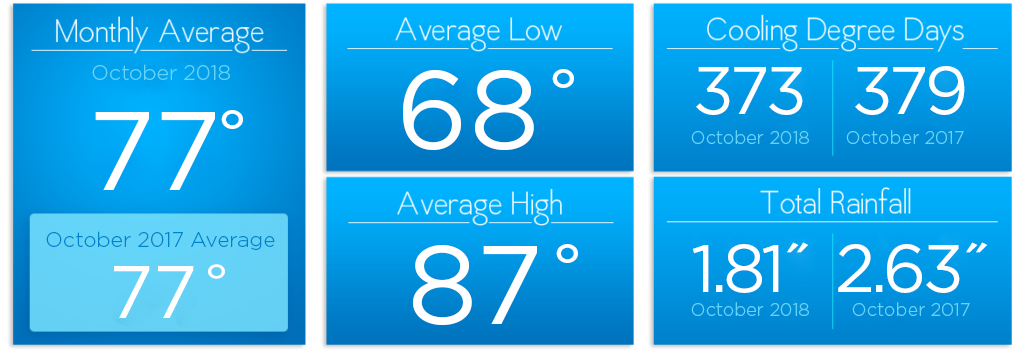
October 2018’s average high of 87° was 2 degrees warmer than last October. The average temp was 77° – still pretty warm for October. Rainfall for October of 2018 was 1.81 inches compared to last October at 2.63 inches.


SECO Energy Sunshine State Stats breakdown October 2018


There were 373 cooling degree days and 1 heating degree days for October 2018, while last year there were 379 cooling degree days with 15 heating degree days. The Degree Days are based on how much warmer or cooler the average temperature at a particular location is than 65°F. In other words, if the average temperature is 60° degrees outside on a particular day, there are 5 Heating Degree Days for that day in that location.


November 2018 is forecast to give us daily high temperatures in the 70s and 80s right through Thanksgiving. Rainfall is forecast to be heavier than normal compared to 2017. By replacing a dirty HVAC filter, you can lower your air conditioner’s energy consumption by 5% – 15%. Per ENERGY STAR, investing in a programmable thermostat can save you up to $180 a year on energy costs. Ask for one for Christmas!


If you want to check historical usage, log into SmartHub to view past bills and charts. If your usage is high, SECO offers several energy-efficiency tools to help you identify energy wasters.


Take the Home Energy Assessment to receive a detailed email tailored to your home’s features and lifestyle. The energy-saving advice will provide low-cost ways to decrease your usage – and your electric bill.


To easily calculate how much energy your appliances, lighting, electronic devices, and other energy-using items in your home consume, use the Energy Estimator. If you want a member of our Energy Services team to come to your home to perform a free energy audit, contact us today to book an appointment.


** Past weather data sourced from Leesburg Airport weather station. 


Sunshine State Stats, August 2018

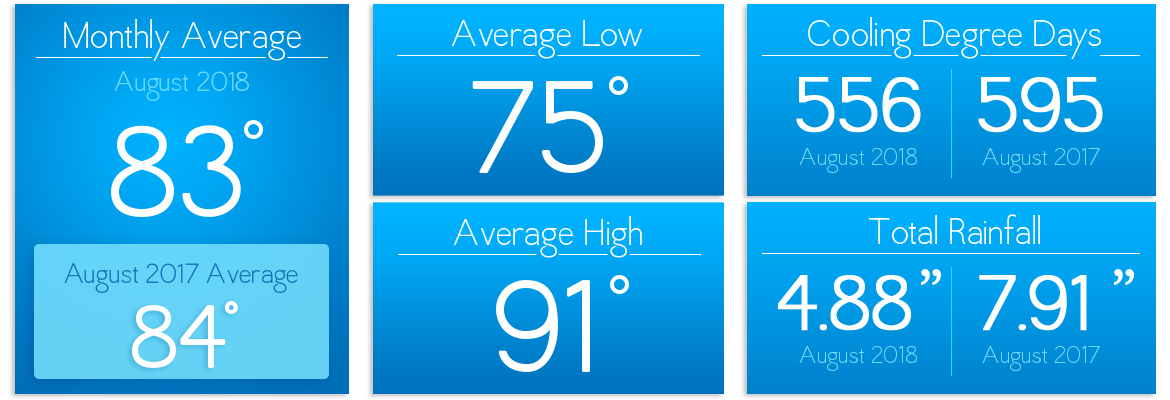
August 2018 was similar on average to August 2017. The average temperature was 83°, while August of 2017 had an average temperature of 84°. The average high this year was 91 – just one degree lower than last year. Though it seemed like it rained every darn day, rainfall for August of 2018 was 4.88 inches compared to last August at 7.91 inches.


SECO Energy Sunshine State Stats breakdown August 2018


There were 556 cooling degree days and 0 heating degree days for August 2018, while last year there were 595 cooling degree days with 0 heating degree days. The Degree Days are based on how much warmer or cooler the average temperature at a particular location is than 65°F. In other words, if the average temperature is 60° degrees outside on a particular day, there are 5 Heating Degree Days for that day in that location.


September 2018 is… well… still hot with highs in the high 80s and low 90s. Rainfall is forecast to be heavier than normal compared to 2017. Thankfully, Fall is around the corner bringing cooler temperatures, allowing your air conditioners to get a much-needed break.


If you want to check historical usage, log into SmartHub to view past bills and charts. If your usage is high, SECO offers several energy-efficiency tools to help you identify energy wasters. Take the Home Energy Assessment to receive a detailed email tailored to your home’s features and lifestyle. The energy-saving advice will provide low-cost ways to decrease your usage – and your electric bill.


To easily calculate how much energy your appliances, lighting, electronic devices, and other energy-using items in your home consume, use the Energy Estimator. If you want a member of our Energy Services team to come to your home to perform a free energy audit, contact us today to book an appointment.

Sunshine State Stats, July 2018

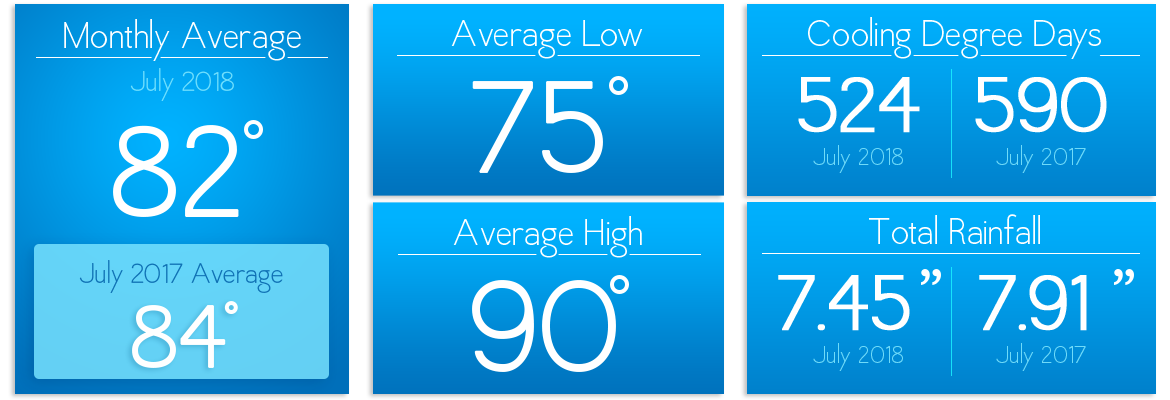
July 2018 was pretty darn hot with nearly daily rain showers. The average high was 90°. The average temperature was 82°, while July of 2017 had an average temperature of 84°. The average low was 75°, compared with an average low of 76° last July. Rainfall for July of 2018 was 7.45 inches compared to last July at 7.91 inches.


Sunshine State Stats July 2018 breakdown


There were 524 cooling degree days and 0 heating degree days for July 2018, while last year there were 590 cooling degree days with 0 heating degree days. The Degree Days are based on how much warmer or cooler the average temperature at a particular location is than 65°F. In other words, if the average temperature is 60° degrees outside on a particular day, there are 5 Heating Degree Days for that day in that location.


August 2018 is forecast to be somewhat the same as last year with average high temperatures in the 90s. Rainfall is forecast to be heavier than normal compared to 2017. The continuation of afternoon showers could give your HVAC units a much-needed break.


Hurricane Season Update: Chances that the global climate pattern El Niño will develop this fall were increased in the most recent forecast, boosting confidence in revised predictions for a below-normal hurricane season. The federal Climate Prediction Center’s July El Niño forecast is giving it a 65 percent chance of appearing in the fall, and about a 70 percent chance of a winter formation.


For Florida, the periodic warming of the equatorial Pacific Ocean can mean a less active hurricane season with fewer of the powerhouse Cat 5 tropical cyclones known to build during the peak months of August through October.


If you want to check historical usage, log into SmartHub to view past bills and charts. If your usage is high, SECO offers several energy-efficiency tools to help you identify energy wasters. Take the Home Energy Assessment to receive a detailed email tailored to your home’s features and lifestyle. The energy-saving advice will provide low-cost ways to decrease your usage – and your electric bill.


To easily calculate how much energy your appliances, lighting, electronic devices, and other energy-using items in your home consume, use the Energy Estimator. If you want a member of our Energy Services team to come to your home to perform a free energy audit, contact us today to book an appointment.

Sunshine State Stats, June 2018

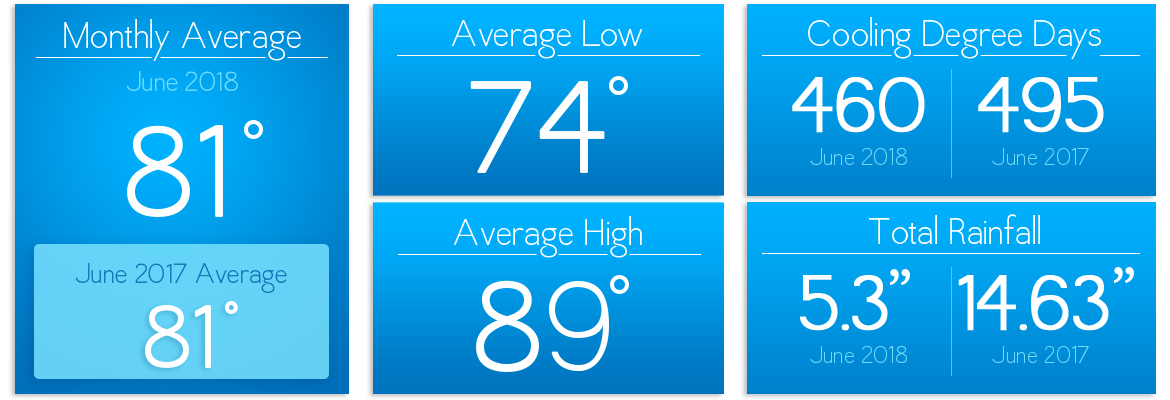
The weather in June 2018 was similar on average to June 2017. The average temperature this June and last June was 81°. Rainfall, however, for June of 2018 was 5.30 inches compared to last June at 14.63 inches.


June 2018 Sunshine State Stats breakdown


There were 460 cooling degree days and 0 heating degree days for June 2018. Similarly, last year there were 495 cooling degree days with 0 heating degree days. The Degree Days are based on how much warmer or cooler the average temperature at a particular location is than 65°F. In other words, if the average temperature is 60° degrees outside on a particular day, there are 5 Heating Degree Days for that day in that location.


July 2018’s temperatures are forecast to be above normal with lows in the 70s and highs in the low 90s. Rainfall is forecast to be heavier than normal compared to 2017. Remember that July is typically one of the hottest months of the year. The excessive heat and humidity will make your HVAC run more frequently, therefore impacting your electric bill. Remember 78 – 80° is the national standard for the HVAC in the summer. Set the thermostat higher to reduce your energy consumption. Just one degree higher can save 6 – 8% on your cooling cost.


If you want to check historical usage, log into SmartHub to view past bills and charts. If your usage is high, SECO offers several energy-efficiency tools to help you identify energy wasters. Take the Home Energy Assessment to receive a detailed email tailored to your home’s features and lifestyle. The energy-saving advice will provide low-cost ways to decrease your usage – and your electric bill.


To easily calculate how much energy your appliances, lighting, electronic devices, and other energy-using items in your home consume, use the Energy Estimator. If you want a member of our Energy Services team to come to your home to perform a free energy audit, contact us today to book an appointment.

Sunshine State Stats, May 2018

May 2018 was slightly cooler on average than May 2017. The average temperature was 77°, while May of 2017 had an average temperature of 79°. Rainfall for May of 2018 was 8.28 inches compared to last May at 2.71 inches.


Sunshine State Stats breakdown May 2018


There were 363 cooling degree days and 0 heating degree days for May 2018, while last year there were 426 cooling degree days with 0 heating degree days. The Degree Days are based on how much warmer or cooler the average temperature at a particular location is than 65°F. In other words, if the average temperature is 60° degrees outside on a particular day, there are 5 Heating Degree Days for that day in that location.


June 2018 is forecast to be somewhat the same as last year with average temperatures in the mid 80’s and 90’s. Rainfall is forecast to be heavier than normal compared to 2017. The hot summer weather is upon us. Remember that every degree below 78° F the thermostat is lowered will increase your cooling costs by 6% – 8% per degree.


Per ENERGY STAR, investing in a programmable thermostat can save you about $180 annually. Wifi models that you can program from your computer or smartphone start at under $100 nowadays. Or you could win a wifi programmable thermostat in our May Facebook incentive. Read May SECO News for details.


Just in time for the 2018 Atlantic hurricane season, SECO debuted an all-new StormCenter outage reporting platform. Bookmark StormCenter on your smartphone or other mobile device today.


If you want to check historical usage, log into SmartHub to view past bills and charts. If your usage is high, SECO offers several energy-efficiency tools to help you identify energy wasters. Take the Home Energy Assessment to receive a detailed email tailored to your home’s features and lifestyle. The energy-saving advice will provide low-cost ways to decrease your usage – and your electric bill.


To easily calculate how much energy your appliances, lighting, electronic devices, and other energy-using items in your home consume, use the Energy Estimator. If you want a member of our Energy Services team to come to your home to perform a free energy audit, contact us today to book an appointment.