StormCenter logo

Archive

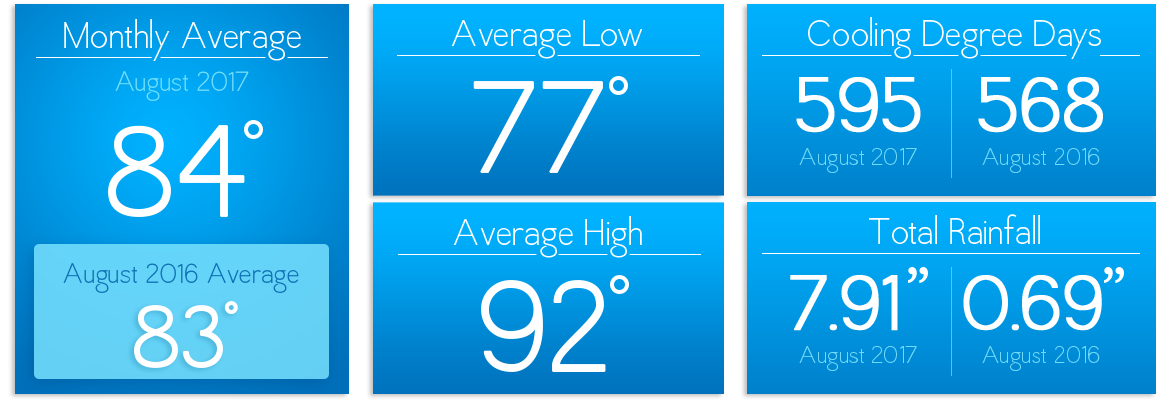
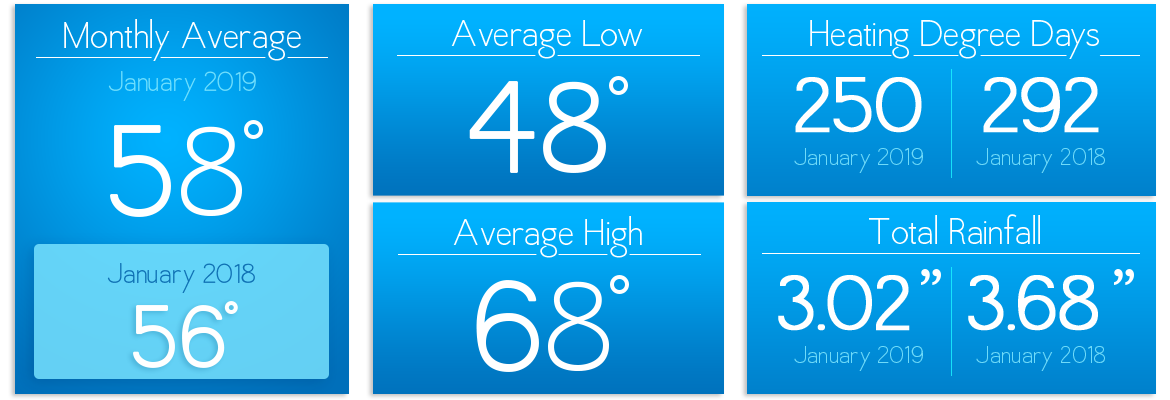
Sunshine State Stats, January 2019

January 2019’s average high was 68° and the average low was 48° – a couple of degrees warmer than last January. January’s average temperature was 58°, while January of 2018 had an average temperature of 56°. Rainfall for January of 2019 was 3.02 inches compared to last January at 3.68 inches.


January 2019 Sunshine State Stats breakdown


Based on data from the Leesburg weather station, February’s average high will hit around 71° and the average low is 49°. Those averages may cause residents to run heating units overnight and to switch to cooling in the afternoons. Based on the current forecast, Central Florida residents will see some afternoon highs in the low to mid 80s in mid-February. That said, if you haven’t changed your HVAC filter since last year, now is a good time to do so. It’s also a good time to have a qualified technician perform a health check on your system – well before the heat of summer is upon us.


Rainfall is forecast to be heavier than normal compared to 2018. For those with heat pumps, raise the thermostat setting no more than 1-2 degrees at a time when heating is being used to prevent back-up heat strips from operating. Heat strips can cost up to 5 times more per hour.


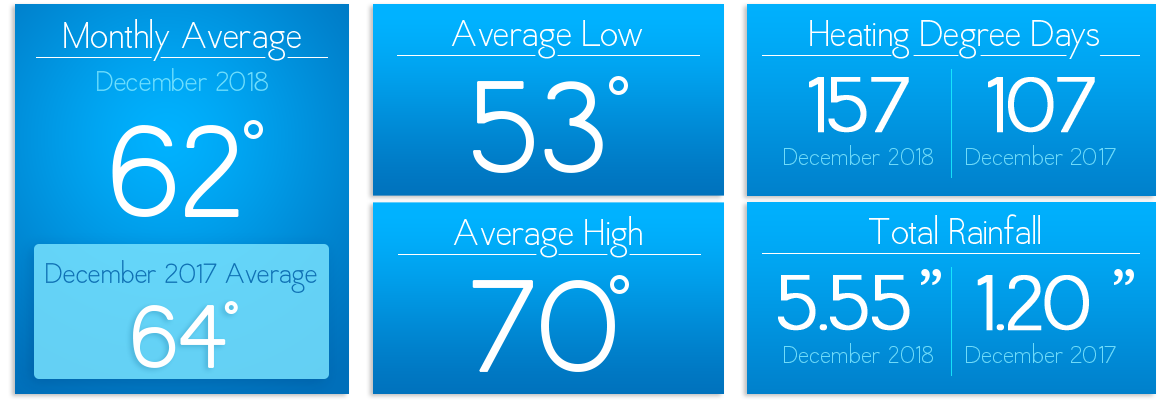
There were 27 cooling degree days and 250 heating degree days for January 2019, while last year there were 29 cooling degree days with 292 heating degree days. The Degree Days are based on how much warmer or cooler the average temperature at a particular location is than 65°F. In other words, if the average temperature is 60° degrees outside on a particular day, there are 5 Heating Degree Days for that day in that location.


If you want to check historical usage, log into SmartHub to view past bills and charts. If your usage is high, SECO offers several energy-efficiency tools to help you identify energy wasters. Take the Home Energy Assessment to receive a detailed email tailored to your home’s features and lifestyle. The energy-saving advice will provide low-cost ways to decrease your usage – and your electric bill.


To easily calculate how much energy your appliances, lighting, electronic devices, and other energy-using items in your home consume, use the Energy Estimator. If you want a member of our Energy Services team to come to your home to perform a free energy audit, contact us today to book an appointment.

Sunshine State Stats, December 2018

December 2018 was chilly compared to December 2017. The average temperature was 62°, while December of 2017 had an average temperature of 64°. The average high in December 2018 was three degrees cooler than 2017. This December also saw heavier precipitation. Rainfall for December 2018 was 5.55 inches compared to last December at 1.20 inches.


SECO Energy Sunshine State Stats December 2018 breakdown


There were 62 cooling degree days and 157 heating degree days for December 2018, while last year there were 81 cooling degree days with 107 heating degree days. The Degree Days are based on how much warmer or cooler the average temperature at a particular location is than 65°F. In other words, if the average temperature is 60° degrees outside on a particular day, there are 5 Heating Degree Days for that day in that location.


January 2019 is forecast to be somewhat the same as last January and is still Central Florida’s coldest month of the year. Our local forecast calls for lows in the 40s for at least sixteen nights in January. Be sure you’ve changed your heating unit’s air filter and have had the unit serviced by a qualified technician. Rainfall is forecast to be heavier than normal so keep an umbrella handy.


For those with heat pumps, raise the thermostat setting no more than 1-2 degrees at a time when heating is being used to prevent back-up heat strips from operating. Heat strips can cost up to five times more per hour in energy use.


If you want to check historical usage, log into SmartHub to view past bills and charts. If your usage is high, SECO offers several energy-efficiency tools to help you identify energy wasters. Take the Home Energy Assessment to receive a detailed email tailored to your home’s features and lifestyle. The energy-saving advice will provide low-cost ways to decrease your usage – and your electric bill.


To easily calculate how much energy your appliances, lighting, electronic devices, and other energy-using items in your home consume, use the Energy Estimator. If you want a member of our Energy Services team to come to your home to perform a free energy audit, contact us today to book an appointment.


** Past weather data sourced from Leesburg Airport weather station. 


Sunshine State Stats, November 2017

November 2017 was slightly warmer than the previous November, so members may have been running their HVAC units more frequently than last year at this time. Thus, your November bill this year may be higher than last year’s November bill. The average temperature came in at 69°, while November of 2016 had an average temperature of 68°. Rainfall came in at 1.51 inches compared to last November at 0.03 inches.


There were 132 cooling degree days and 7 heating degree days for November 2017, while last year there were 118 cooling degree days with 27 heating degree days. The Degree Days are based on how much warmer or cooler the average temperature at a particular location is than 65°F. In other words, if the average temperature is 60° degrees outside on a particular day, there are 5 Heating Degree Days for that day in that location.


Sunshine State Stats November 2017 Temperature layout

This December is forecast to be similar to last December with precipitation being higher than normal. At the time of this writing, a cold front is forecast to creep into Central Florida around December 7 with lows in the 30s. Therefore, heating costs will increase electric usage and bills. Per ENERGY STAR, you can save 3-5% annually on heating costs for each degree lower you set the thermostat during the winter. And you can save up to $180 annually with a programmable thermostat.


If you want to check historical usage, log into SmartHub to view past bills and charts. If your usage is high, SECO offers several energy-efficiency tools to help you identify energy wasters. Take the Home Energy Assessment to receive a detailed email tailored to your home’s features and lifestyle. The energy-saving advice will provide low-cost ways to decrease your usage – and your electric bill.


To easily calculate how much energy your appliances, lighting, electronic devices, and other energy-using items in your home consume, use the Energy Estimator. If you want a member of our Energy Services team to come to your home to perform a free energy auditcontact us today to book an appointment.

Sunshine State Stats, October 2017

October 2017 was slightly warmer than the previous October, so members’ usage and bills may be slightly higher than in October 2016. The average temperature came in at 77°, while October 2016 had an average temperature of 75°. Rainfall in October 2017 came in at 2.63 inches compared to last October at 1.90 inches.


There were 379 cooling degree days and 15 heating degree days for October 2017, while last year there were 332 cooling degree days with 0 heating degree days. The Degree Days are based on how much warmer or cooler the average temperature at a particular location is than 65°F. In other words, if the average temperature is 70 degrees outside on a particular day, there are 5 Cooling Degree Days for that day in that location.


Sunshine State Stats, October 2017 average numbers

Degree days are measures of how cold or warm a location is. A degree day compares the mean (the average of the high and low) outdoor temperatures recorded for a location to a standard temperature, usually 65°Fahrenheit (F) in the United States. The more extreme the outside temperature, the higher the number of degree days. A high number of degree days generally results in higher levels of energy use for heating or cooling. Learn more about temperature’s effect on energy usage.


November’s temperature forecast is fairly close to normal with an average of 68 degrees. Precipitation is forecast to be higher than normal compared to last year. Consider keeping your heating thermostat between 68 to 70 degrees or lower during the cooler months of the year to lower your energy use.


If you want to check historical usage, log into SmartHub to view past bills and charts. If your usage is high, SECO offers several energy-efficiency tools to help you identify energy wasters. Take the Home Energy Assessment to receive a detailed email tailored to your home’s features and lifestyle. The energy-saving advice will provide low-cost ways to decrease your usage – and your electric bill.


To easily calculate how much energy your appliances, lighting, electronic devices, and other energy-using items in your home consume, use the Energy Estimator. If you want a member of our Energy Services team to come to your home to perform a free energy audit, contact us today to book an appointment.

Sunshine State Stats, September 2017

September 2017’s Sunshine State Stats and the local weather was about the same as the previous September – with the exception of Cat 2/3 Hurricane Irma that barreled through the center of the state on Sunday, September 9.   The average temperature came in at 82°, while September of 2016 was a degree higher with an average temperature of 83°. Rainfall came in at 9.68 inches compared to last September at 6.14 inches. This was mainly due to Hurricane Irma.


There were 514 cooling degree days and 0 heating degree days for September 2017, while last year there were 502 cooling degree days with 0 heating degree days. The Degree Days are based on how much warmer or cooler the average temperature at a particular location is than 65°F. In other words, if the average temperature is 70° degrees outside on a particular day, there are 5 Cooling Degree Days for that day in that location.


SECO Energy's Sunshine State Stats for September 2017 - September's monthly averages and stats


October is forecast to be slightly warmer than normal with precipitation being higher than normal compared to last year. The hot and humid days of 2017 are almost behind us –  bringing lower energy bills. If you want to check historical usage, log into SmartHub to view past bills and charts.


If your usage is high, SECO offers several energy-efficiency tools to help you identify energy wasters. Take the Home Energy Assessment to receive a detailed email tailored to your home’s features and lifestyle. The energy-saving advice will provide low-cost ways to decrease your usage – and your electric bill.


To easily calculate how much energy your appliances, lighting, electronic devices, and other energy-using items in your home consume, use the Energy Estimator. If you want a member of our Energy Services team to come to your home to perform a free energy audit, contact us today to book an appointment.

Sunshine State Stats, August 2017

August 2017 was slightly warmer than the previous August. The average temperature came in at 84°, while August of 2016 had an average temperature of 83°. Rainfall came in at 7.91 inches compared to last August at a mere 0.69 inches.


There were 595 cooling degree days and 0 heating degree days for August 2017, while last year there were 568 cooling degree days with 0 heating degree days. The Degree Days are based on how much warmer or cooler the average temperature is at a particular location is than 65°. In other words, if the average temperature is 70° degrees outside on a particular day, there are 5 Cooling Degree Days for that day in that location.


SECO Energy's Sunshine State Stats, August 2017 - monthly averages and stats


September is forecast to be slightly warmer with precipitation higher than normal compared to last year. Hurricane Irma wreaked havoc on the area as well, so it will be interesting to see how the natural disaster affects the overall Sunshine State Stats at the end of the month. Fall is around the corner bringing cooler temperatures and allowing your air conditioners a much needed break. If you want to check historical usage, log into SmartHub to view past bills and charts.

If your usage is high, SECO offers several energy-efficiency tools to help you identify energy wasters. Take the Home Energy Assessment to receive a detailed email tailored to your home’s features and lifestyle. The energy-saving advice will provide low-cost ways to decrease your usage – and your electric bill.


To easily calculate how much energy your appliances, lighting, electronic devices, and other energy-using items in your home consume, use the Energy Estimator. If you want a member of our Energy Services team to come to your home to perform a free energy audit, contact us today to book an appointment.