September 2021 Sunshine State Stats
Fall arrived in September 2021 and temperatures began to cool off slightly. Don’t get out your heavy jacket yet. Winter temperatures are still months away and daily highs are still hitting over 90 degrees.
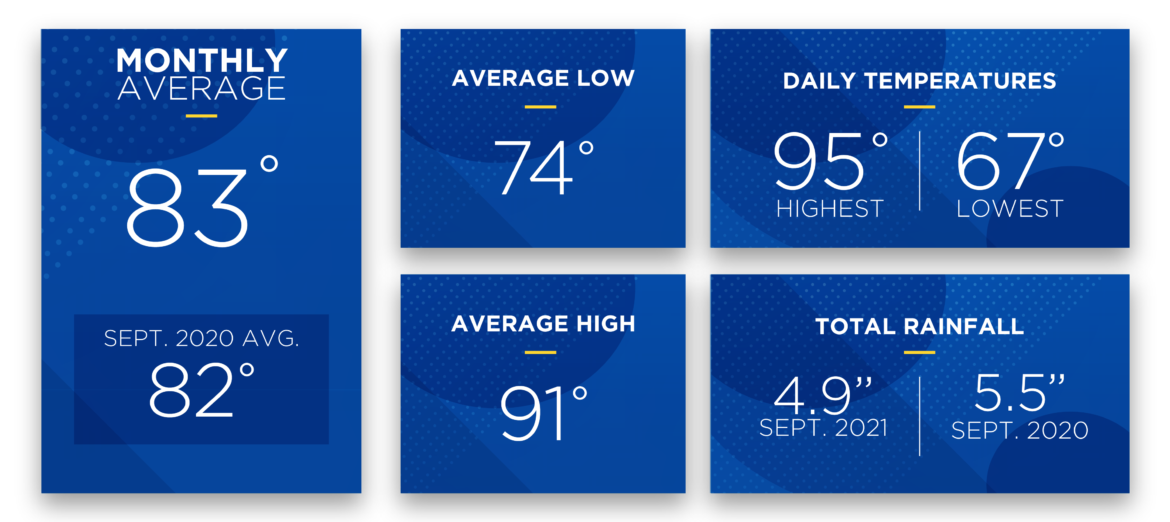
In September 2021, the highest daily temperature recorded was 95 degrees, which is 4 degrees lower than the highest recorded temp in August 2021. The lowest recorded temperature this month was 67 degrees, which 6 degrees lower than the lowest temp recorded in August 2021. Rainfall increased from last month by a very small amount to measure 4.9 inches and is below September’s average of 5.76 inches.
September is the peak of hurricane season, while the month was active with tropical storm and hurricane activity, Central Florida remained clear of named-storm activity. As a reminder, the Atlantic hurricane season runs through November 30. It is best to remain vigilant and prepared in the event a late-season tropical storm or hurricane turns our way before the end of the season.
For September 2021 the average temperature was 83 degrees, which is one degree higher than the average temperature in September 2020. The average high temperature in September 2021 was 91 degrees, and the average low temperature was 74.
Although the average monthly temperature and average low and high temperatures have decreased slightly from August 2021, daily temperatures are still warm. Members may notice their energy usage for September 2021 will be similar to their usage from August 2021. Warm daily temperatures and Florida’s humidity mean HVACs will run for longer periods of time and more frequently to keep the temperatures cool inside. Daily temperature fluctuations also increase HVAC usage.
October forecast:
The October forecast shows a slight cool down in daily high temperatures to the high 80s and low 90s. Lows will be in the high 60s and low 70s. The rainy season is coming to a close, the best chance for rain is the possibility of scattered thunderstorms that bring lightning and wind during the first half of the month.
Take the bite out of damaging surges and spikes with SECO Energy’s Surge MitiGator surge protection. Our meter-based surge arrester protects large appliances by reducing surges BEFORE they enter the meter. Learn more about the Surge MitiGator.
To check historical usage, log into SmartHub to view past bills and consumption charts. If your usage is high, SECO offers several energy-efficiency tools to help you identify energy wasters. Take the Home Energy Assessment to receive a detailed email tailored to your home’s features and lifestyle. The energy-saving advice will provide low-cost ways to decrease your usage – and your electric bill.
To easily calculate how much energy your appliances, lighting, electronic devices, and other energy-using items in your home consume, use the Energy Estimator.