July 2021 Sunshine State Stats
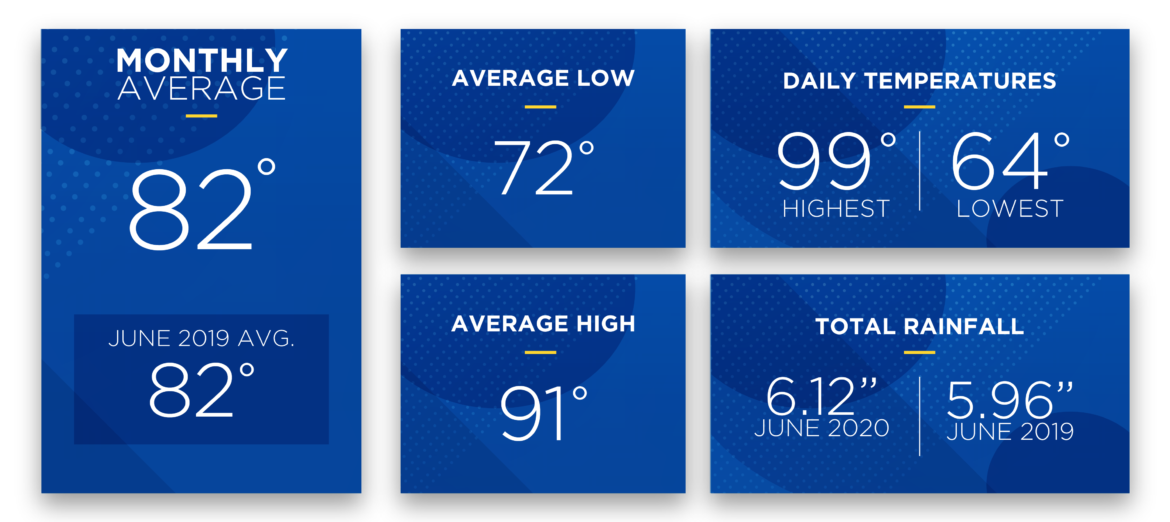
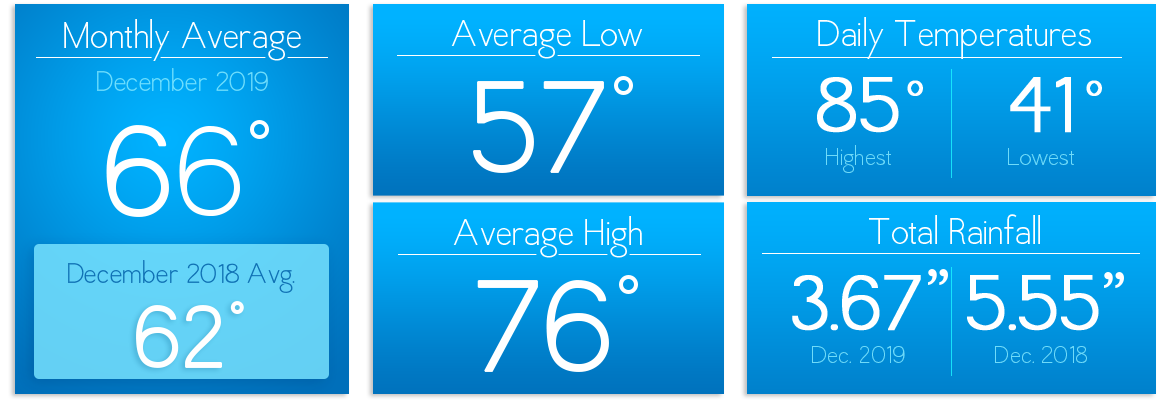
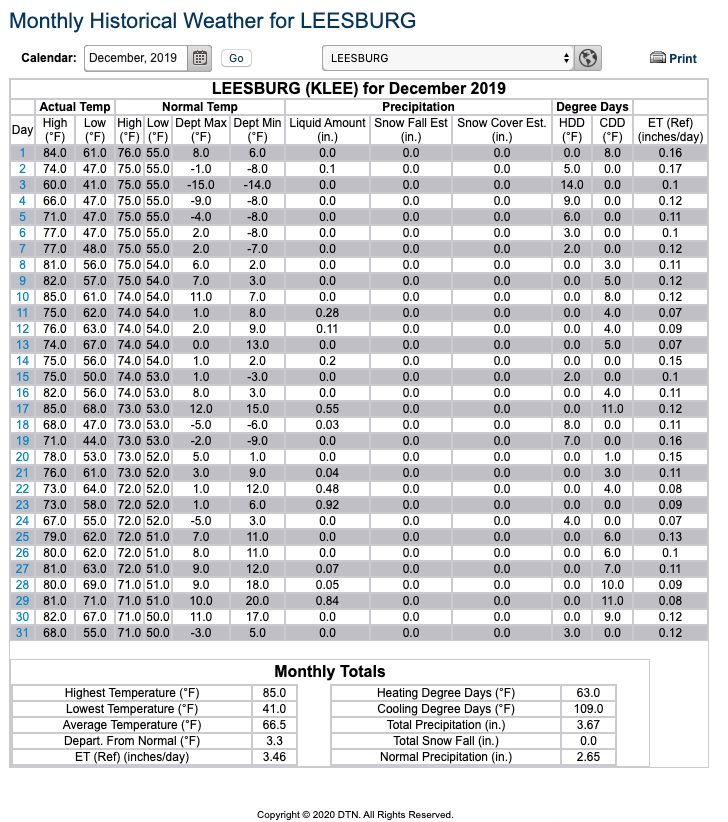
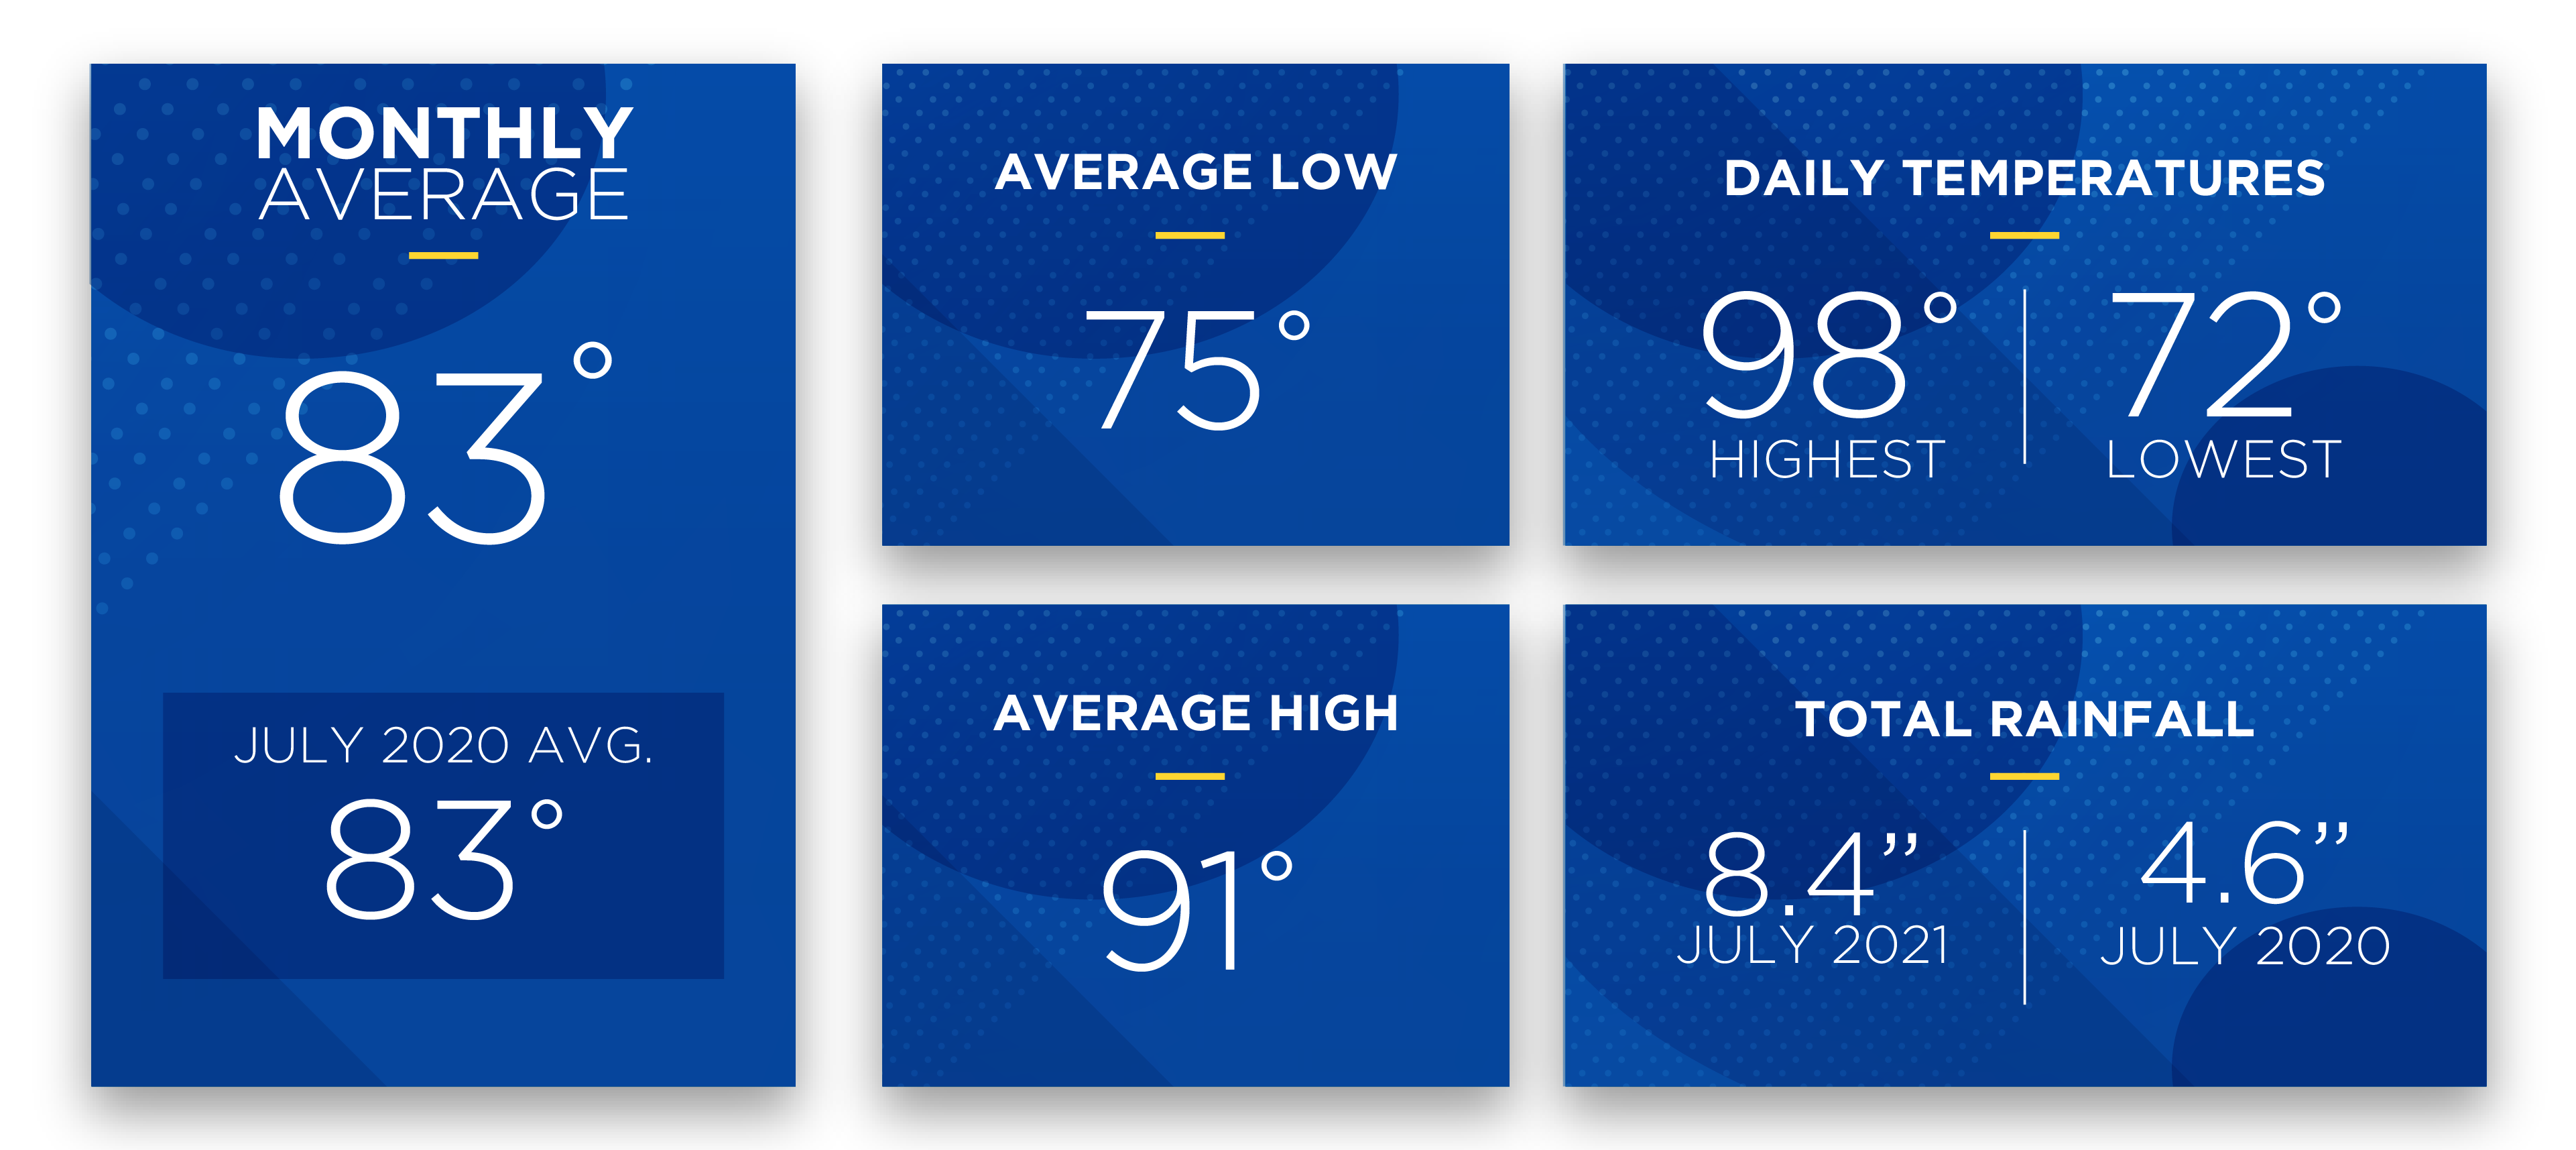
Mother Nature increased both the daily temperatures and precipitation in July 2021. The highest daily temperature measured in at 98 degrees, and the lowest temperature came in at 72 degrees. Tropical Storm Elsa brought heavy rain, winds, tornado warnings and watches to our area on July 6th and 7th for our first test of the 2021 Atlantic hurricane season.
July was seasonably hot with afternoon thunderstorms occurring almost daily. During July’s 31 days, 24 of those reached a high temp of over 90 degrees. Because of the increased temperatures, members will likely notice an increase in their July electric usage.
For July 2021 the average temperature was 83 degrees, which was the same as the average temperature in July 2020. The average high temperature in July 2021 was 91 degrees, and the average low temperature was 75. Total precipitation this month measured 8.4 inches compared to 4.6 inches in July last year.
Both the average monthly temperature and average low and high temperatures have increased from June 2021. Again, members will likely see an increase in their energy usage for July 2021. Hotter temperatures and increased humidity mean HVACs will run for longer periods of time and more frequently to keep the temperatures cool inside. Daily temperature fluctuations also increase HVAC usage.
August forecast:
The threat of tropical storms and hurricanes increases as we enter August, and the threat peaks in September. Expect rain – our rainy season continues through September with daily thunderstorms that bring rain, lightning and wind. Daily highs will reach 90 degrees and above with lows in the 70s.
Take the bite out of damaging surges and spikes with SECO Energy’s Surge MitiGator surge protection. Our meter-based surge arrester protects large appliances by reducing surges BEFORE they enter the meter. Learn more about the Surge MitiGator. In August and September, members enrolled in surge protection are entered in a drawing to win a portable generator each month. Enroll today for the chance to win!
To check historical usage, log into SmartHub to view past bills and consumption charts. If your usage is high, SECO offers several energy-efficiency tools to help you identify energy wasters. Take the Home Energy Assessment to receive a detailed email tailored to your home’s features and lifestyle. The energy-saving advice will provide low-cost ways to decrease your usage – and your electric bill.
To easily calculate how much energy your appliances, lighting, electronic devices, and other energy-using items in your home consume, use the Energy Estimator.