StormCenter logo

Archive

Sunshine State Stats January 2020

Central Floridians experienced extreme temperature variations in January 2020 with very warm daytime temperatures that reached as high as 86 degrees and overnight temperatures that dipped into the 30s and 40.
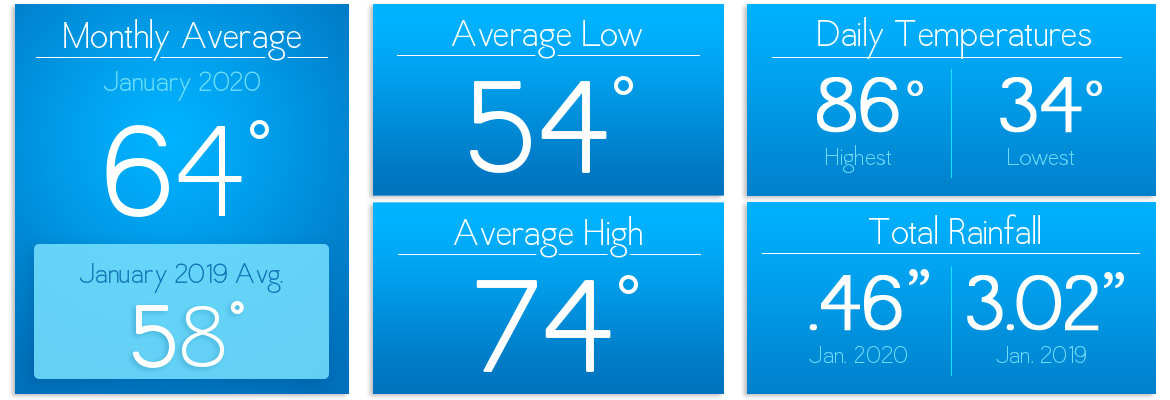
 

SECO Energy Sunshine State Stats January 2020 breakdown


The monthly average temperature was a balmy 64 degrees – which was 6 degrees warmer than the average temperature in January 2019. The highest daily recorded temperature was 86 degrees and the lowest daily recorded temperature was 34 degrees. That’s a fluctuation of 52 degrees between hot and cold so most likely both cooling and heating units ran in January.


January 2020’s average high temperature was 74 degrees with an average low of 54. In Janaury 2019, the average high temperature was 69 degrees while the average low temperature was 47 degrees.


January 2020 low temperatures were so cold that frozen iguanas in Florida became a common sight. Locally we enjoyed 9 days of high temperatures over 80 degrees in Janaury 2020 and 11 days of low temps in the 30s and 40s. Rainfall for the month was lower than average at only .46 inches. Rainfall for January 2019 was much higher than 2020 at 3.02 inches.


Members who used heat during the colder mornings and cooling in the warmer afternoons can expect to see an increase in energy consumption on their January billing statement. ENERGY STAR recommends setting your heat to no higher than 68 degrees during the winter months.


Have you scheduled an annual HVAC service? January and February are typically the coldest months in Florida. A well-maintained unit runs more efficiently and helps lower your energy usage. Read more about HVAC service and maintenance in November SECO News.


February 2020 forecast:


February 2020 is forecast for an average high of 76 degrees most days in the month reaching temperatures in the mid-70s and 80s. The average low is forecast at 56 degrees with low temperatures dipping into the 40s and 50s. Precipitation levels are forecast to be low with the best chance for rain early in the month.


To check historical usage, log into SmartHub to view past bills and consumption charts. If your usage is high, SECO offers several energy-efficiency tools to help you identify energy wasters. Take the Home Energy Assessment to receive a detailed email tailored to your home’s features and lifestyle. The energy-saving advice will provide low-cost ways to decrease your usage – and your electric bill.


To easily calculate how much energy your appliances, lighting, electronic devices, and other energy-using items in your home consume, use the Energy Estimator.
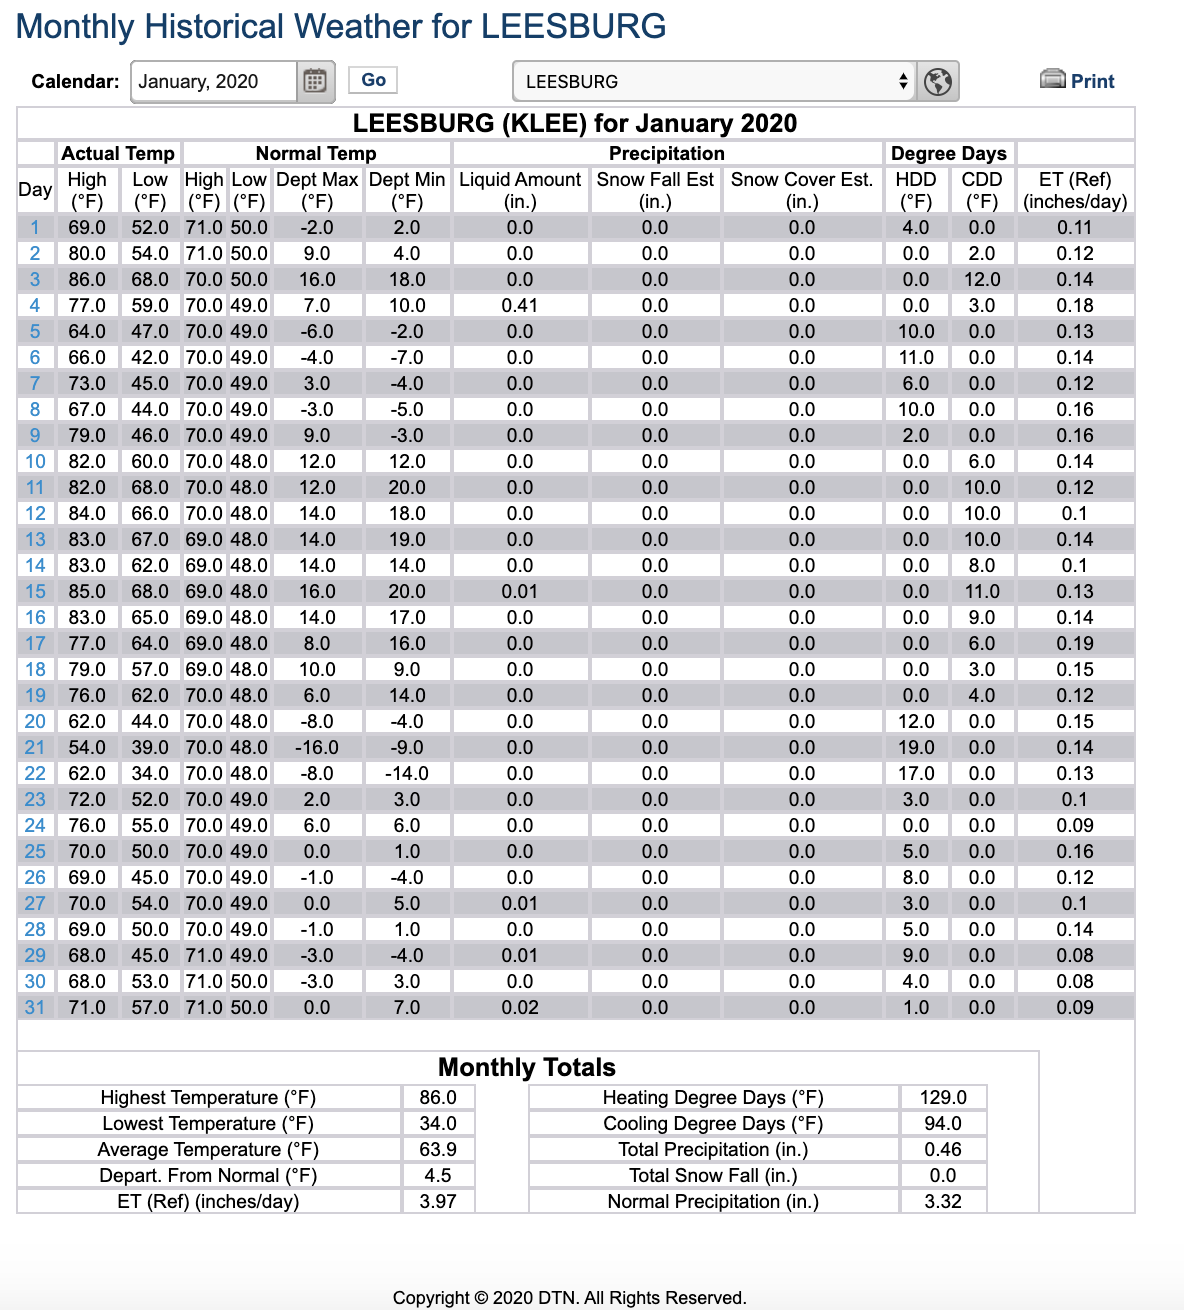

 

January 2020 weather chart

Sunshine State Stats December 2019

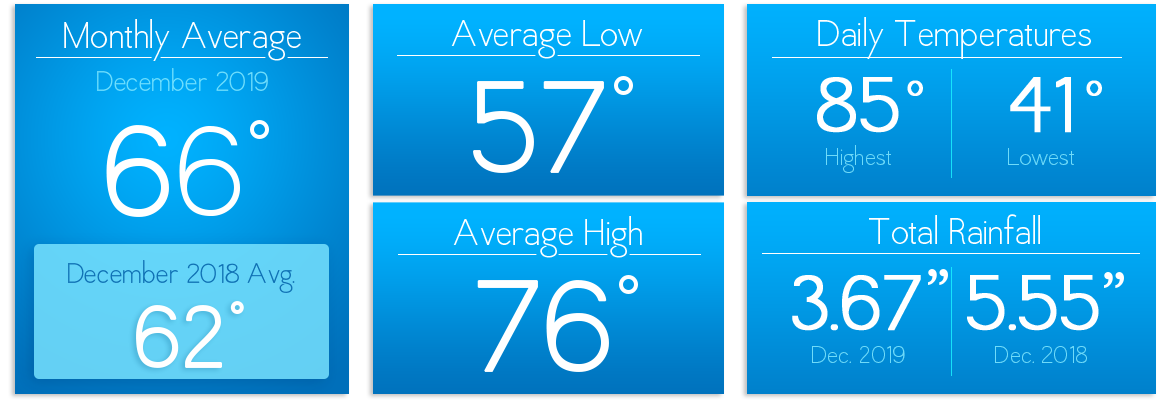
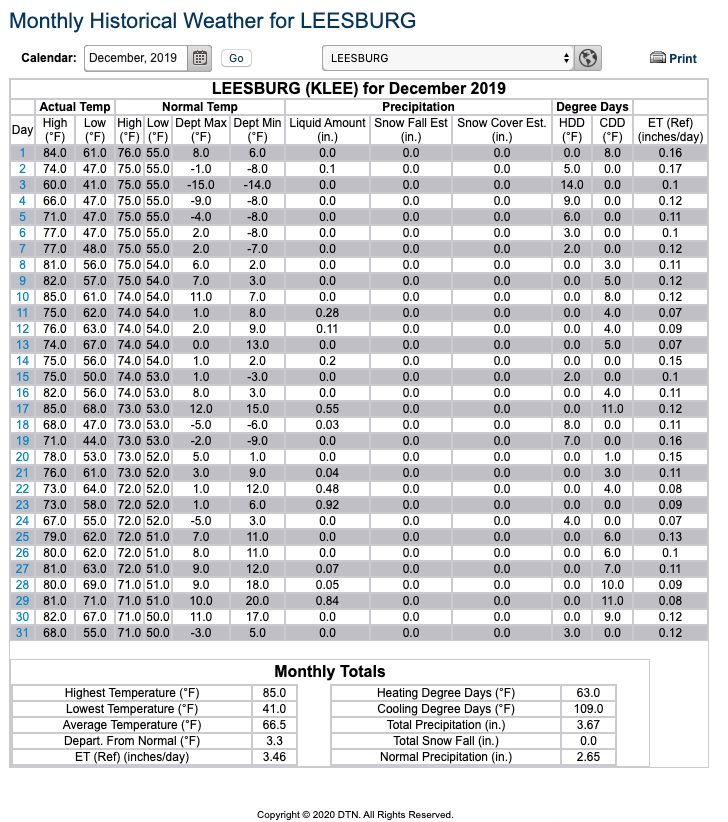
Central Florida didn’t see a White Christmas in December 2019. The temperatures were warm even by Central Florida standards. The monthly average temperature was a mild 66 degrees – which was 4 degrees warmer than the average temperature in December 2018. The highest daily recorded temperature was 85 degrees and the lowest daily recorded temperature was 41 degrees. That’s a fluctuation of 44 degrees between hot and cold so most likely both cooling and heating units ran in December.


SECO Sunshine State Stats December 2019 Breakdown


December 2019’s average high temperature was 76 degrees with an average low temperature of 57 degrees. In December 2018, the average high temperature was 71 degrees while the average low temperature was 53 degrees.


Families who were visiting for the holidays from colder areas were pleased with the warm temperatures. Locally we enjoyed 11 days of high temperatures over 80 degrees in December 2019. Rainfall for the month was higher than last month at 3.67 inches. Rainfall for December 2018 was higher than 2019 at 5.55 inches.


While parts of the U.S. were blanketed in snow, Central Florida’s early morning temperatures were in the mid to high forties. If you had visiting family and friends, the afternoon highs and extra visitors probably required extra HVAC cooling. Members who used heat during the colder mornings and cooling in the warmer afternoons can expect to see an increase in energy consumption on their December billing statement. ENERGY STAR recommends setting your heat to no higher than 68 degrees during the winter months.


Have you scheduled an annual HVAC service? January and February are typically the coldest months in Florida. A well-maintained unit runs more efficiently and helps lower your energy usage. Read more about HVAC service and maintenance in November SECO News.


January 2020 forecast:


January 2020 is forecast for an average high of 75 degrees with high temperatures reaching the low 80s. The average low is forecast at 56 degrees with 14 or 15 days dropping into the 40s. Precipitation levels are forecast to be low with the best chance for rain in the middle of the month.


To check historical usage, log into SmartHub to view past bills and consumption charts. If your usage is high, SECO offers several energy-efficiency tools to help you identify energy wasters. Take the Home Energy Assessment to receive a detailed email tailored to your home’s features and lifestyle. The energy-saving advice will provide low-cost ways to decrease your usage – and your electric bill.


To easily calculate how much energy your appliances, lighting, electronic devices, and other energy-using items in your home consume, use the Energy Estimator.


December 2019 Weather Sentry Chart for Sunshine State Stats

Sunshine State Stats November 2019

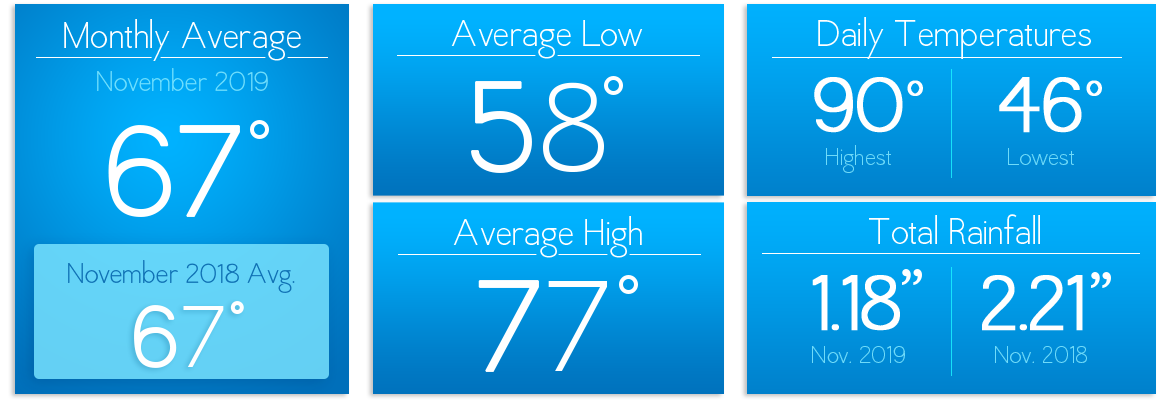
Cooler temperatures arrived in Central Florida in November 2019. The monthly average temperature was a comfortable 67 degrees – which was the same average temperature in November 2018. The highest daily recorded temperature was 90 degrees and the lowest daily recorded temperature was 46 degrees. That’s a big fluctuation between hot and cold so both heating and cooling units likely ran in November.


November 2019 Sunshine State Stats details


November 2019’s average high temperature was 78 degrees with an average low temperature of 57 degrees. In November 2018, the average high temperature was 77 degrees while the average low temperature was 58 degrees.


Parts of the U.S. experienced record-breaking cold temperatures. Locally, we enjoyed 17 days of high temperatures over 80 degrees in November 2019. Rainfall for the month was 1.18 inches, which was down slightly from November 2018’s total of 2.21 inches.


The arctic fronts that arrived in Florida during November 2019 brought some very cold early morning temperatures. Members who turned on the heat during these temperature drops can expect to see an increase in energy consumption on their November billing statement. ENERGY STAR recommends setting your heat to no higher than 68 degrees during the winter months.


With the cooling temperatures, now is a good time to schedule an HVAC technician to service your unit. A well-maintained unit runs more efficiently and helps lower your energy usage. Read more about HVAC service and maintenance in November SECO News.


December 2019 forecast:


December 2019 is forecast for an average high of 72 degrees and an average low over 52 degrees with seven or eight days dropping into the 40s. Precipitation levels are forecast to be low with the best chance for rain at the beginning of the month.


To check historical usage, log into SmartHub to view past bills and consumption charts. If your usage is high, SECO offers several energy-efficiency tools to help you identify energy wasters. Take the Home Energy Assessment to receive a detailed email tailored to your home’s features and lifestyle. The energy-saving advice will provide low-cost ways to decrease your usage – and your electric bill.


To easily calculate how much energy your appliances, lighting, electronic devices, and other energy-using items in your home consume, use the Energy Estimator.

Sunshine State Stats October 2019

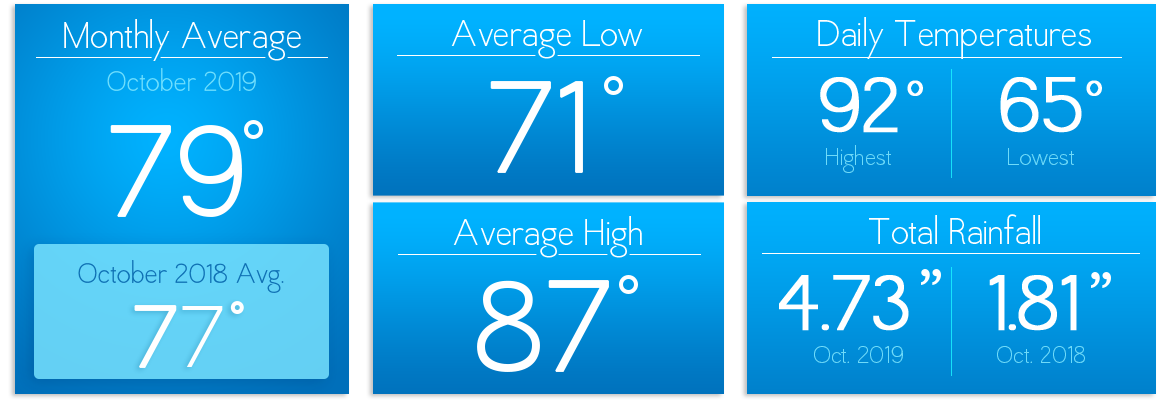
October 2019’s monthly average temperature was a warm 79 degrees – which was 2 degrees warmer than last October’s average temperature of 77 degrees. The highest daily recorded temperature was 92 degrees and the lowest daily recorded temperature was 65 degrees.


Sunshine State Stats October 2019


Central Floridian’s felt the effects of Tropical Storm Nestor in the middle of the month with increased rainfall. In October 2019, rainfall came in at 4.73 inches – up from 1.81 inches last October.


October 2019’s average high temperature was 87 degrees which matches the average high temperature for October 2018. The average low temperature was 71 degrees, which was 3 degrees higher than the average low of 68 degrees in October 2018.


Based on the warmer average temps and higher than projected kilowatt hour sales, many members received an electric bill for October usage that is higher than the bill received for usage in October 2018.


November 2019 forecast:


November 2019 is forecast for an average high of 78 degrees which is the same as the average high temperature in November 2018. The best chance for rain is at the beginning of the month and the forecast looks to be drier in November 2019 compared to November 2018.


If you want to check historical usage, log into SmartHub to view past bills and charts. If your usage is high, SECO offers several energy-efficiency tools to help you identify energy wasters. Take the Home Energy Assessment to receive a detailed email tailored to your home’s features and lifestyle. The energy-saving advice will provide low-cost ways to decrease your usage – and your electric bill.


To easily calculate how much energy your appliances, lighting, electronic devices, and other energy-using items in your home consume, use the Energy Estimator.

Sunshine State Stats September 2019

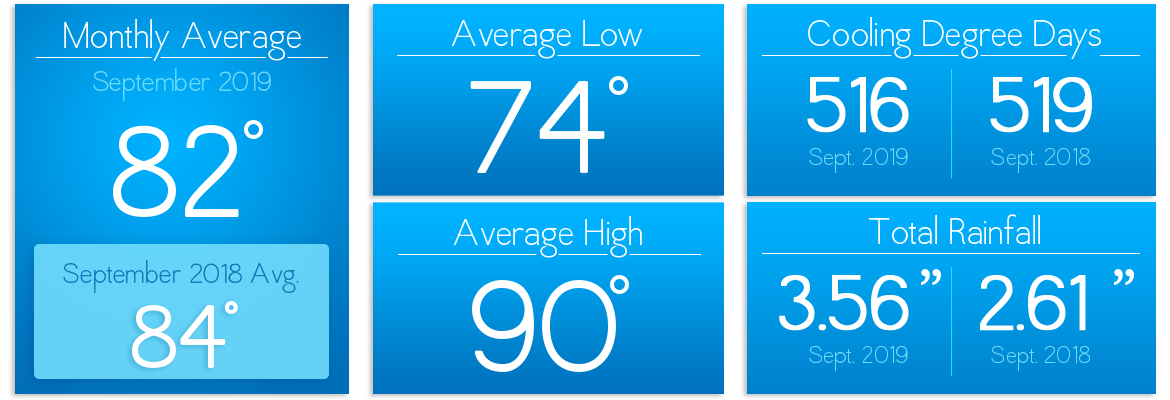
September 2019 gave Floridians a small glimpse of fall weather with temperatures that were a little cooler than September 2018. The average high temperature in September 2019 was 90 degrees compared to an average high temperature of 92 degrees in September 2018. Hurricane Dorian’s near visit to our area increased rainfall in September 2019 to 3.56” compared to 2.61” last September.

Sunshine State Stats September 2019 breakdown


The average low temperature was 74 degrees, which was a little lower than the average low temperature of 76 degrees in September 2018. The maximum temperature for both September 2019 and 2018 was 95 degrees and the minimum temperature for September 2019 was a cool 67 degrees compared to 73 degrees for September 2018.


There were 516 cooling degree days and 0 heating degree days for September 2019, while last year there were 519 cooling degree days with 0 heating degree days. The Degree Days are based on how much warmer or cooler the average temperature at a particular location is than 65 degrees. In other words, if the average temperature is 60 degrees outside on a particular day, there are 5 Heating Degree Days for that day in that location.


October forecast:


October 2019 is forecast for an average high of 84 degrees which is three degrees cooler than last year’s average high. Rainfall is forecast to be similar this October to the precipitation amount in October 2018.


If you want to check historical usage, log into SmartHub to view past bills and charts. If your usage is high, SECO offers several energy-efficiency tools to help you identify energy wasters. Take the Home Energy Assessment to receive a detailed email tailored to your home’s features and lifestyle. The energy-saving advice will provide low-cost ways to decrease your usage – and your electric bill.


To easily calculate how much energy your appliances, lighting, electronic devices, and other energy-using items in your home consume, use the Energy Estimator. If you want a member of our Energy Services team to come to your home to perform a free energy audit, contact us today to book an appointment.

** Past weather data sourced from Leesburg Airport weather station.

Sunshine State Stats, May 2019

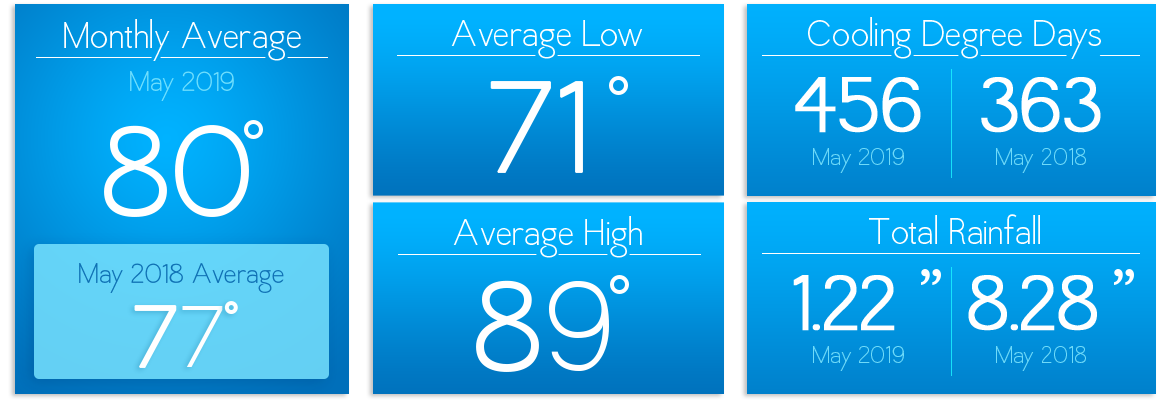
May 2019 was a heck of a lot hotter than May 2018 with an average high of 89 compared to 85 last year. The average temperature was 80° – a full three degrees hotter, as May of 2018 had an average temperature of 77°. Rainfall was down significantly for May of 2019 at just 1.22 inches compared to last May at 8.28 inches.

SECO Energy Sunshine State Stats May 2019 details


There were 456 cooling degree days and 0 heating degree days for May 2019, while last year there were 363 cooling degree days with 0 heating degree days. The Degree Days are based on how much warmer or cooler the average temperature at a particular location is than 65°F. In other words, if the average temperature is 60° outside on a particular day, there are 5 Heating Degree Days for that day in that location.


JUNE FORECAST:


June 2019 is forecast for an average high of 89 degrees which is very close to last year’s average high. Rainfall is forecast to be heavier than normal this June compared to 2018.


If you want to check historical usage, log into SmartHub to view past bills and charts. If your usage is high, SECO offers several energy-efficiency tools to help you identify energy wasters. Take the Home Energy Assessment to receive a detailed email tailored to your home’s features and lifestyle. The energy-saving advice will provide low-cost ways to decrease your usage – and your electric bill.


To easily calculate how much energy your appliances, lighting, electronic devices, and other energy-using items in your home consume, use the Energy Estimator. If you want a member of our Energy Services team to come to your home to perform a free energy audit, contact us today to book an appointment.
 

** Past weather data sourced from Leesburg Airport weather station.

Sunshine State Stats, March 2019

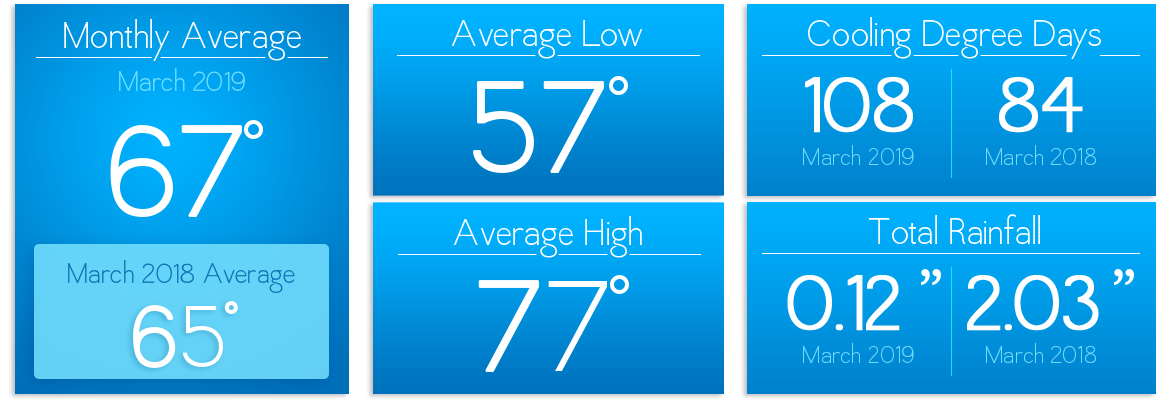
March 2019 was slightly warmer than March 2018. The average high temperature was 77 – one degree hotter than last year. Rainfall for March of 2019 was 0.12 inches compared to last March at 2.03 inches.

Sunshine State Stats breakdown March 2019

Based on data from the Leesburg weather station, April’s average high will heat up to the mid 80s, and the average historical low is 58 degrees. This variance could mean toggling between cooling your home in the day and heating it at night as temperatures drop. That said, if you haven’t changed your HVAC filter since last year, now is a good time to do so. It’s also a good time to have a qualified technician perform a health check on your system.


April rainfall is forecast to be heavier than normal compared to 2018. Warmer weather is right around the corner, so remember that every degree above 78 degrees on your thermostat will save you 6%-8% on your cooling costs.


If you’re interested in the HDDs and CDDs, there were 108 cooling degree days and 62 heating degree days for March 2019, while last year there were 84 cooling degree days with 67 heating degree days. The Degree Days are based on how much warmer or cooler the average temperature at a particular location is than 65°F. In other words, if the average temperature is 60° degrees outside on a particular day, there are 5 Heating Degree Days for that day in that location.


If you want to check historical usage, log into SmartHub to view past bills and charts. If your usage is high, SECO offers several energy-efficiency tools to help you identify energy wasters. Take the Home Energy Assessment to receive a detailed email tailored to your home’s features and lifestyle. The energy-saving advice will provide low-cost ways to decrease your usage – and your electric bill.


To easily calculate how much energy your appliances, lighting, electronic devices, and other energy-using items in your home consume, use the Energy Estimator. If you want a member of our Energy Services team to come to your home to perform a free energy audit, contact us today to book an appointment.
 

** Past weather data sourced from Leesburg Airport weather station.

Sunshine State Stats, January 2019

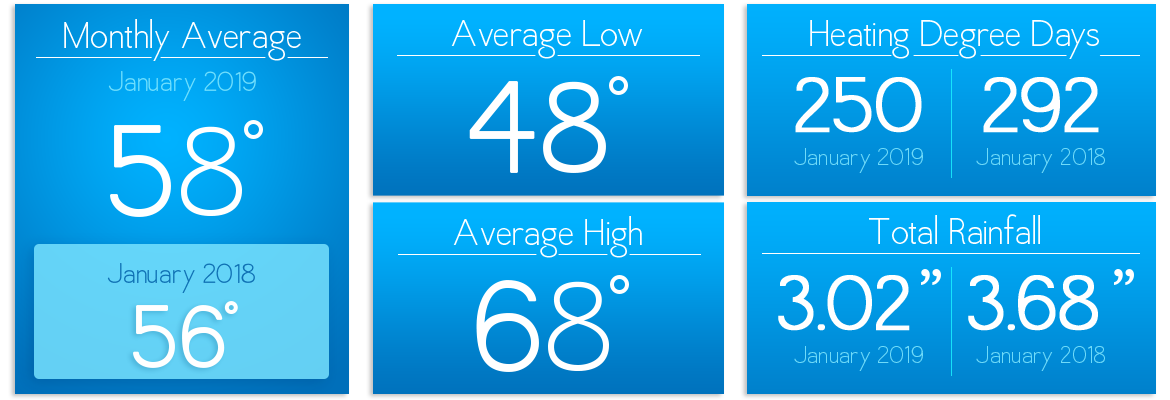
January 2019’s average high was 68° and the average low was 48° – a couple of degrees warmer than last January. January’s average temperature was 58°, while January of 2018 had an average temperature of 56°. Rainfall for January of 2019 was 3.02 inches compared to last January at 3.68 inches.


January 2019 Sunshine State Stats breakdown


Based on data from the Leesburg weather station, February’s average high will hit around 71° and the average low is 49°. Those averages may cause residents to run heating units overnight and to switch to cooling in the afternoons. Based on the current forecast, Central Florida residents will see some afternoon highs in the low to mid 80s in mid-February. That said, if you haven’t changed your HVAC filter since last year, now is a good time to do so. It’s also a good time to have a qualified technician perform a health check on your system – well before the heat of summer is upon us.


Rainfall is forecast to be heavier than normal compared to 2018. For those with heat pumps, raise the thermostat setting no more than 1-2 degrees at a time when heating is being used to prevent back-up heat strips from operating. Heat strips can cost up to 5 times more per hour.


There were 27 cooling degree days and 250 heating degree days for January 2019, while last year there were 29 cooling degree days with 292 heating degree days. The Degree Days are based on how much warmer or cooler the average temperature at a particular location is than 65°F. In other words, if the average temperature is 60° degrees outside on a particular day, there are 5 Heating Degree Days for that day in that location.


If you want to check historical usage, log into SmartHub to view past bills and charts. If your usage is high, SECO offers several energy-efficiency tools to help you identify energy wasters. Take the Home Energy Assessment to receive a detailed email tailored to your home’s features and lifestyle. The energy-saving advice will provide low-cost ways to decrease your usage – and your electric bill.


To easily calculate how much energy your appliances, lighting, electronic devices, and other energy-using items in your home consume, use the Energy Estimator. If you want a member of our Energy Services team to come to your home to perform a free energy audit, contact us today to book an appointment.

Sunshine State Stats, December 2018

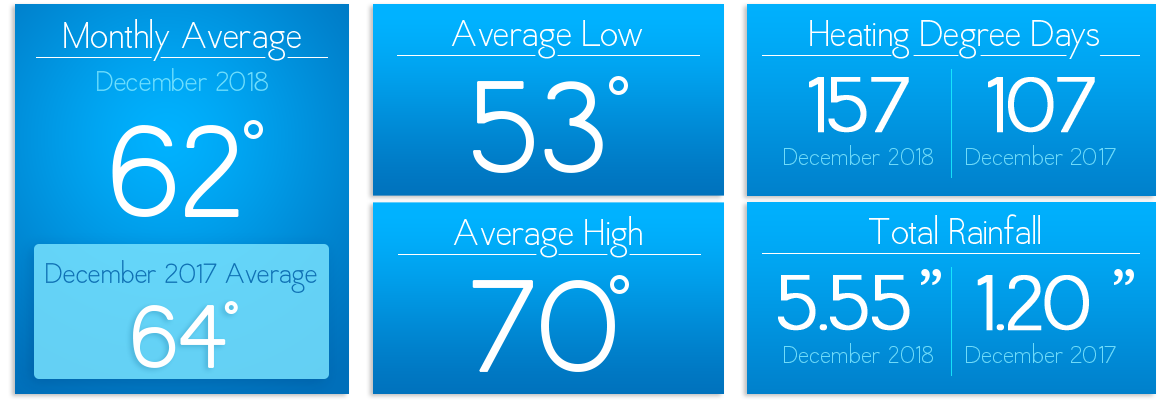
December 2018 was chilly compared to December 2017. The average temperature was 62°, while December of 2017 had an average temperature of 64°. The average high in December 2018 was three degrees cooler than 2017. This December also saw heavier precipitation. Rainfall for December 2018 was 5.55 inches compared to last December at 1.20 inches.


SECO Energy Sunshine State Stats December 2018 breakdown


There were 62 cooling degree days and 157 heating degree days for December 2018, while last year there were 81 cooling degree days with 107 heating degree days. The Degree Days are based on how much warmer or cooler the average temperature at a particular location is than 65°F. In other words, if the average temperature is 60° degrees outside on a particular day, there are 5 Heating Degree Days for that day in that location.


January 2019 is forecast to be somewhat the same as last January and is still Central Florida’s coldest month of the year. Our local forecast calls for lows in the 40s for at least sixteen nights in January. Be sure you’ve changed your heating unit’s air filter and have had the unit serviced by a qualified technician. Rainfall is forecast to be heavier than normal so keep an umbrella handy.


For those with heat pumps, raise the thermostat setting no more than 1-2 degrees at a time when heating is being used to prevent back-up heat strips from operating. Heat strips can cost up to five times more per hour in energy use.


If you want to check historical usage, log into SmartHub to view past bills and charts. If your usage is high, SECO offers several energy-efficiency tools to help you identify energy wasters. Take the Home Energy Assessment to receive a detailed email tailored to your home’s features and lifestyle. The energy-saving advice will provide low-cost ways to decrease your usage – and your electric bill.


To easily calculate how much energy your appliances, lighting, electronic devices, and other energy-using items in your home consume, use the Energy Estimator. If you want a member of our Energy Services team to come to your home to perform a free energy audit, contact us today to book an appointment.
 

** Past weather data sourced from Leesburg Airport weather station. 


Sunshine State Stats, October 2018

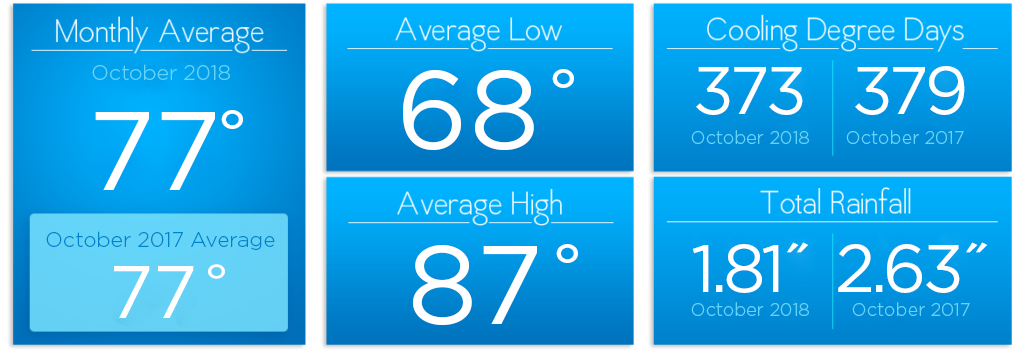
October 2018’s average high of 87° was 2 degrees warmer than last October. The average temp was 77° – still pretty warm for October. Rainfall for October of 2018 was 1.81 inches compared to last October at 2.63 inches.


SECO Energy Sunshine State Stats breakdown October 2018


There were 373 cooling degree days and 1 heating degree days for October 2018, while last year there were 379 cooling degree days with 15 heating degree days. The Degree Days are based on how much warmer or cooler the average temperature at a particular location is than 65°F. In other words, if the average temperature is 60° degrees outside on a particular day, there are 5 Heating Degree Days for that day in that location.


November 2018 is forecast to give us daily high temperatures in the 70s and 80s right through Thanksgiving. Rainfall is forecast to be heavier than normal compared to 2017. By replacing a dirty HVAC filter, you can lower your air conditioner’s energy consumption by 5% – 15%. Per ENERGY STAR, investing in a programmable thermostat can save you up to $180 a year on energy costs. Ask for one for Christmas!


If you want to check historical usage, log into SmartHub to view past bills and charts. If your usage is high, SECO offers several energy-efficiency tools to help you identify energy wasters.


Take the Home Energy Assessment to receive a detailed email tailored to your home’s features and lifestyle. The energy-saving advice will provide low-cost ways to decrease your usage – and your electric bill.


To easily calculate how much energy your appliances, lighting, electronic devices, and other energy-using items in your home consume, use the Energy Estimator. If you want a member of our Energy Services team to come to your home to perform a free energy audit, contact us today to book an appointment.


** Past weather data sourced from Leesburg Airport weather station.